Mr Rocky, can you take a screenshot in your next trading day in the moment when you select the currency pairs than gona trade with this method, gona help a lot to understand the proces of filter, thank you
i mean the method its easy and its clear but the hard part is when we have to filter de currenncys where we implement this method, i am new in this proces and its very hard understand without a contex image in the moment when you select every pair or the moment when you can see the strong/weak currencys help
A few traders have reached out to me of late seeking some guidance. Please note that I do not provide personal mentoring. I am a full time trader and I assist my wife with another business we own and I just do not have the time. I have posted a strategy that MIGHT assist traders in implementing Rocky's entry methodology. I say MIGHT because success is based on so many different variables unique to each trader. To that end therefore I am not making any comments/promises that this system will work. I use it for one of my strategies and it has been working well for me but it does not mean anyone will replicate my results. Further, markets do change from trending to consolidating and this can make me revise my view. What I do know however is this is a systematic approach to (a) filtering opportunities and (b) entry.
Stops/take profits etc are at the discretion of traders. My best advise for new traders is to look at this system for the next 6-8 weeks. Mark every 60 Min opportunity and then see if entry sets up following. Record the results. Screen shot every opportunity. Get your eye used to spotting the set up. What you will learn about the various nuances from undertaking this process will result in the best education for you that is available. You just have to put the screen time in. Be cautious about red flag news, higher time-frame S&R, time of day/session, ADR etc.
Finally commit to reading one Mark Douglas book by the end of September; and ...."the greedy become the needy". No-one goes broke taking profits. Build your account of 20-30 pip gains and be thankful for the odd 80-100 pip winner.
Note that my chart examples have MACD (only use for Divergence) and Stochastic which I use for my main trading strategy and they have no bearing on this system.
{quote} Thank you! Do you pay attention to structures like key levels or certain price action to make up your mind? Good trading anyway.
Ignored
Hi FH, ....
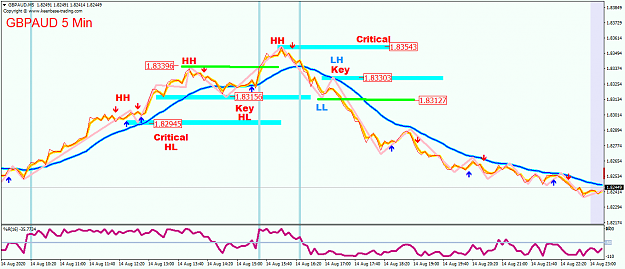
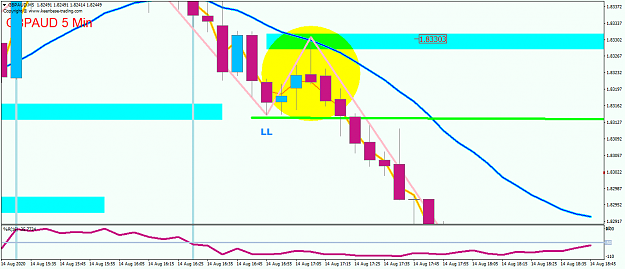
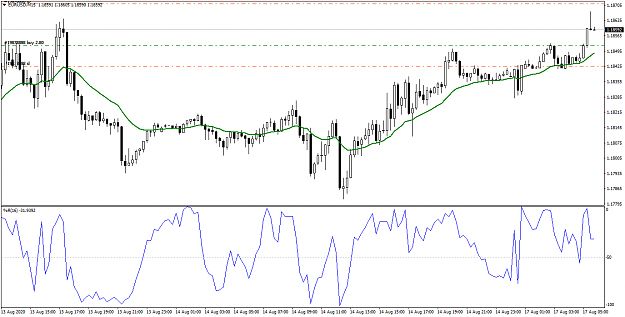
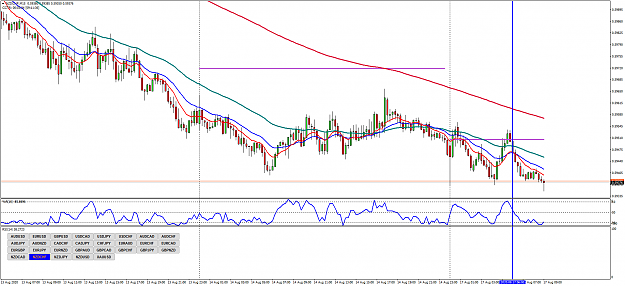
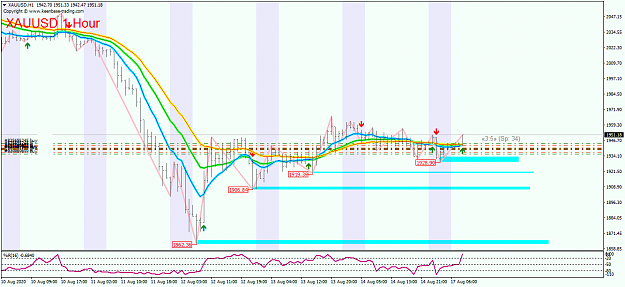
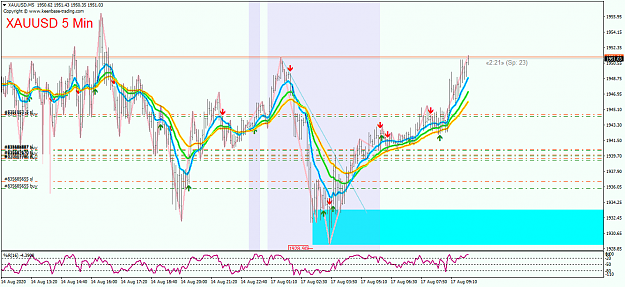
Please have look at the chart below... we can find the peak area , chart will tell you exactly ....at S/R area
you need to be patience to observe before you execution to entry to the market .. remember price action signal at this area when the price start break out the key area and the critical area ...
And Price Action signal to confirm of trend continue going down ...
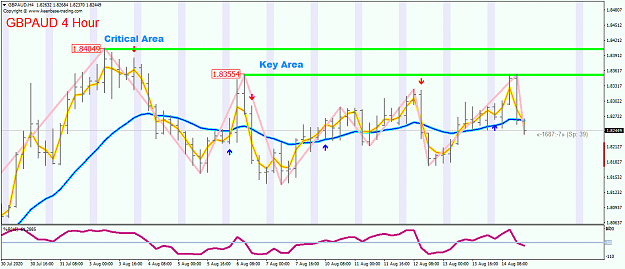
In The H4 Chart .... do the same critical area point and the Key area point ...
{quote} Hi FH, .... Please have look at the chart below... we can find the peak area , chart will tell you exactly ....at S/R area you need to be patience to observe before you execution to entry to the market .. remember price action signal at this area when the price start break out the key area and the critical area ... And Price Action signal to confirm of trend continue going down ... In The H4 Chart .... do the same critical area point and the Key area point ... {image} {image} {image}
Ignored
Agreed. All my Charts have the next relevant S&R marked from the 4HR Chart.
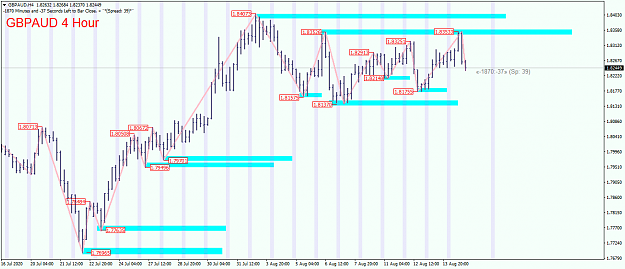
{quote} Hi FH, .... Please have look at the chart below... we can find the peak area , chart will tell you exactly ....at S/R area you need to be patience to observe before you execution to entry to the market .. remember price action signal at this area when the price start break out the key area and the critical area ... And Price Action signal to confirm of trend continue going down ... In The H4 Chart .... do the same critical area point and the Key area point ... here is H4 GBPAUD .... {image} {image} {image} {image}
Ignored
Thank you mrhb30jr for the insights. I also take into consideration the previous day's high and low. Your key level indicator looks great, can you share the name? THanks.
Thank you RobDragon. I will test your 60min - 5min system. It makes more sense to trade with the momentum from a higher timeframe.
Overall, thanks, Rocky for sharing the system. I learned a lot from this topic.
{quote} Thank you mrhb30jr for the insights. I also take into consideration the previous day's high and low. Your key level indicator looks great, can you share the name? THanks. Thank you RobDragon. I will test your 60min - 5min system. It makes more sense to trade with the momentum from a higher timeframe. Overall, thanks, Rocky for sharing the system. I learned a lot from this topic.
I did came up with this tread few weeks ago. and it got me interested as the way the creator of the tread explain the strategy which quite simple and very effective which uses trend continuation strategy . the reason i get interested is some strategy uses in the tread quite similar to what i'm trading in some parameters . first of all i want to thank to rockypoint for the great work and effort he has done to explain that to others
what i can say is for long run this strategy can make decent and profitable income. there is no holly grail in Forex. Market can move any direction in matter of time. and there is no indicator which built to catch every move on market. lot of new traders missing some great opportunities on trading as they looking to win each trade we place which is not possible. its all combination of patience discipline Following the rules strictly and physiology
missing one part of this can bring any great system to worst. and then they start blaming the creator of the strategy for that which is not good
I like the fact that you are using power of currencies to select the pairs for the trading which make the winning % to even high in some facts. overall this strategy has over 50% win rate which is more than enough to make good income. and with good analyse my human this can bring to even higher as then can ignore most trades when price in range
For my personal trading i use some other parameters . But i will discuss on here regarding whats the creator of this forum explain. do not need to make the forum too much noise with many parameters
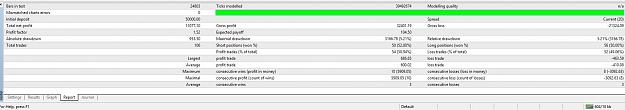
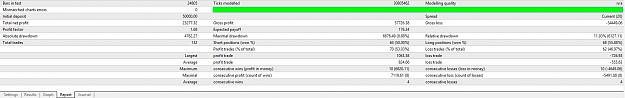
I did some back-test with the strategy and in automation which bring over 50% win rate in most pairs. EURUSD pair does not bring good result with the strategy but remember i created some codes and run on back-tester with 99% quality history data and there is no human interference involve on the result i just post here.
Normally i use my own correlation pattern to select strong and weak pairs which cannot use for these test . and i also do not use the break-even money management function for this. this uses fixed SL and TP which base on 1:1.5 Risk Reword Ratio and Risk per trade is only 1% and 1 trade per day which trigger the highest probability trade during the day
{quote} Hi FH33, only using .ZIGZAG indicator setting 4,4,2 ....
Ignored
Thanks. I was asking about the indicator that draws support and resistance levels. It seems to be a feature of the zigzag indicator that you use.
However, zigzag alone is good enough for mapping out tested sharp points = key levels. Thanks.
Can I ask about your process of picking pairs? Do you keep a watch list or use the currency power to pick potential pairs for the trading session?
Thanks for your responses. I do appreciate the help from you guys.
{quote} Thanks. I was asking about the indicator that draws support and resistance levels. It seems to be a feature of the zigzag indicator that you use. However, zigzag alone is good enough for mapping out tested sharp points = key levels. Thanks. Can I ask about your process of picking pairs? Do you keep a watch list or use the currency power to pick potential pairs for the trading session? Thanks for your responses. I do appreciate the help from you guys.
Ignored
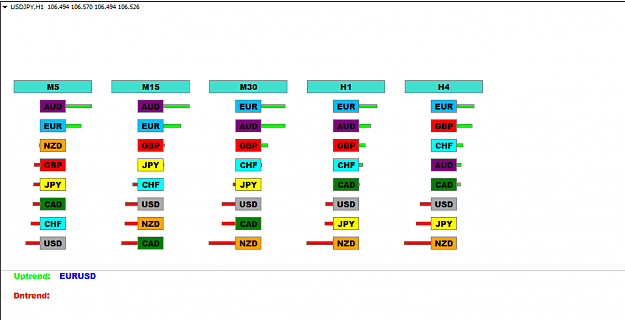
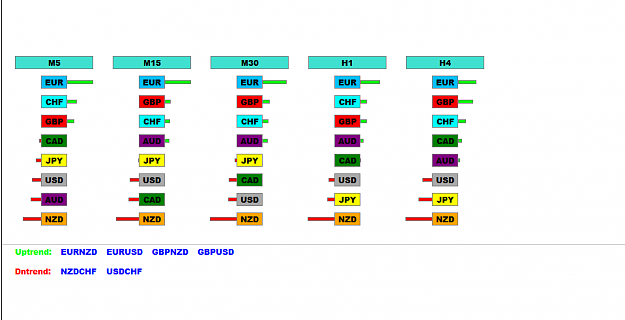
FH33, yes that will help to see the strong of currency, every weekend normally i already choosing my pair to be watching for the coming week, i draw S/R in my chart and indicate potential of the pair to be trade ... that we call them the plan of trade ... base on this i will work out for the coming week, i just trade base on the listing that i was preparing ...that all,...
EU long Trade Placed 20 seems acting as a good support at the moment
Attached Image (click to enlarge)
From Correlation EUR strong and USD week i will wait and see how it place if it didn't reach TP before Frankfurt open i will close by manually or set the SL to breakeven
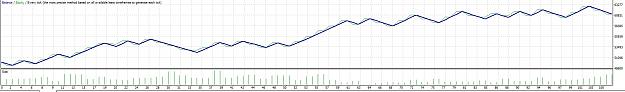
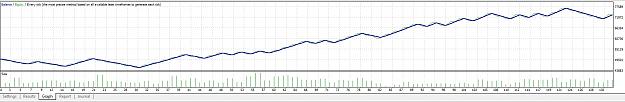
On AUD JPY One year Back test the strategy discussing on the forum here has good winning rate . winning rate over 53% . Risk Reword is 1:1.5 only 1% risk per trade
{quote} FH33, yes that will help to see the strong of currency, every weekend normally i already choosing my pair to be watching for the coming week, i draw S/R in my chart and indicate potential of the pair to be trade ... that we call them the plan of trade ... base on this i will work out for the coming week, i just trade base on the listing that i was preparing ...that all,...
On AUD JPY One year Back test the strategy discussing on the forum here has good winning rate . winning rate over 53% . Risk Reword is 1:1.5 only 1% risk per trade {image} {image}
Ignored
Hi bigband, since you only take one trade a day, is there a preferrer session or other rules to clear out false signals? There could be tons of false signals in M5 if we only take the 2 rules (Long: price above 20EMA, W% above -50).
{quote} Hi bigband, since you only take one trade a day, is there a preferrer session or other rules to clear out false signals? There could be tons of false signals in M5 if we only take the 2 rules (Long: price above 20EMA, W% above -50).
Ignored
Yes I only take one trade per pair per a day. which mean i do not take more than one trade on any pair . Yes i use some other parameters to filter the trade out specially i use my own algorithm which i created to measure powerful and week currencies. and i use price action when the market is choppy i stay away. and there is no certain time to trade. but in my personal view when i enter a trade on Asian market i use close attention as most of the time where market goes in Asian market there is chance to reverse most of the time when London open.
Other than that basically i use same rules where the forum members suggest