• Home
  • Forums
  • Trades
  • News
  • Calendar
  • Market
  • Brokers
  • Login
  • Join
  • User/Email: Password:
  • 6:43pm
Menu
  • Forums
  • Trades
  • News
  • Calendar
  • Market
  • Brokers
  • Login
  • Join
  • 6:43pm
Sister Sites
  • Metals Mine
  • Energy EXCH
  • Crypto Craft

Options

Bookmark Thread

First Page First Unread Last Page Last Post

Print Thread

Similar Threads

How to flow with the order flow? 26 replies

Applying Order Flow & Volume Profiles To Futures Trading 121 replies

Reading Order Flow 19 replies

Order Flow 26 replies

Oanda Order Flow Box 5 replies

  • Trading Discussion
  • /
  • Reply to Thread
  • Subscribe
  • 131
Attachments: Discussions on Order Flow/Volume
Exit Attachments
Tags: Discussions on Order Flow/Volume
Cancel

Discussions on Order Flow/Volume

  • Last Post
  •  
  • 1 89Page 101112 26
  • 1 9Page 1011 26
  •  
  • Post #181
  • Quote
  • Dec 20, 2019 9:03am Dec 20, 2019 9:03am
  •  NeilWagner
  • | Additional Username | Joined Mar 2017 | 484 Posts
Quoting danasa
Disliked
{quote} Can't yet! but should it have a killer application, it is a matter of requesting this option from the developer of the indicator. No useful application, suggested by members here or the Don, no need to waste time coding it.
Ignored
Got it & thanks for your clarification. Have a good weekend!
 
 
  • Post #182
  • Quote
  • Dec 21, 2019 10:01am Dec 21, 2019 10:01am
  •  jmflukeiii
  • Joined Oct 2011 | Status: Member | 1,418 Posts
Quoting DonPato
Disliked
{quote} Here are the points to consider: Talking about futures NOT FX and as you just saw in the YM shot above...between sessions there is very little volume and price can become volatile because of this very thing He is talking about using 10's of millions of dollars in transaction size to create this movement...You got this kind of cash? Finally he makes a point of saying this kind of thing is temporary until the "big" money comes in which case he then "fades" his own position. (SAR) I have seen this very thing when I trade futures and I watch...
Ignored
DP, I’m quoting this post as it contains a chart I’d like some clarity on, purely technical related to how the bars are constructed. I assume the blue horizontal bars are BUY DELTA, red is SELL DELTA. I’m not sure why there are different shades of these two as sometimes the blue bars are longer/wider and darker blue, but sometimes the dark blue are shorter. I don’t know if that’s a secret but if you’d care to answer, I’d be very interested.

The other question I had is: is the delta at each of these price points a diagonal delta or horizontal at that price point?

The first long in your image; I have been watching these bars for awhile now, and I have not seen a bar with such strong buy delta near the lows of a bar (such as where you took your long). So either I’m misunderstanding your chart/how it’s constructed or my profile bars aren’t telling me the same thing as your profile bars.

Generally I see heavy sell delta at the low of the bars which I see as absorption, but it seems to me that if you see absorption at the low (i.e. heavy Bid volume but price moves up) and then heavy buy delta kicks in (i.e. heavy ask volume with price also moving up), that would be a good sign that not only are passive buyers buying heavy, but buyers (including perhaps the passive buyers that didn’t fill all their passive orders) are having to also now chase price back up as they didn’t fill all their orders at the low.

So seeing that overall buy delta at the lows of the bar caught my attention as it perhaps indicates that scenario I just outlined.

Any thoughts or comments on any of the above would be much appreciated. Thank you!
Small disciplines repeated with consistency lead to great achievements.
 
1
  • Post #183
  • Quote
  • Dec 21, 2019 12:42pm Dec 21, 2019 12:42pm
  •  HiddenGap
  • Joined Aug 2009 | Status: Reading the tape | 2,324 Posts
Quoting jmflukeiii
Disliked
Generally I see heavy sell delta at the low of the bars which I see as absorption, but it seems to me that if you see absorption at the low (i.e. heavy Bid volume but price moves up) and then heavy buy delta kicks in (i.e. heavy ask volume with price also moving up), that would be a good sign that not only are passive buyers buying heavy, but buyers (including perhaps the passive buyers that didn’t fill all their passive orders) are having to also now chase price back up as they didn’t fill all their orders at the low...
Ignored
I'm curious to see what DonPato has to say, but you are correct. There should be more selling at the low (DELTA) because the sellers are the ones aggressively trading "at the market", while the buyers are passively trading with resting, "limit", orders.
Wyckoff VSA: (1) Supply vs Demand (2) Effort vs Result (3) Cause vs Effect
 
 
  • Post #184
  • Quote
  • Dec 21, 2019 1:35pm Dec 21, 2019 1:35pm
  •  jmflukeiii
  • Joined Oct 2011 | Status: Member | 1,418 Posts
Quoting HiddenGap
Disliked
{quote} I'm curious to see what DonPato has to say, but you are correct. There should be more selling at the low (DELTA) because the sellers are the ones aggressively trading "at the market", while the buyers are passively trading with resting, "limit", orders.
Ignored
Right, but it seems like if you also get strong buy delta as price then moves off the low, it would be the clearest indication of price’s next movement. Passive buyers initially absorbing aggressive selling, but aggressive sellers run out (exhaust) before passive buyers get all their orders filled, so they then start buying aggressively, creating buy delta, perhaps in volume sufficient to overcome the initial chart display of sell delta at the lows.

I just found that bar interesting in his chart because I haven’t seen heavy buy delta near the lows of any bar (at least on the intraday bar intervals I trade) . Perhaps my color coding is different, my platform is measuring delta differently (horizontal instead of diagonal), or I am misunderstanding DP’s bar’s color coding. Or perhaps this just rarely occurs, or requires more trading activity (longer bar interval) to print such a bar.
Small disciplines repeated with consistency lead to great achievements.
 
 
  • Post #185
  • Quote
  • Dec 21, 2019 1:45pm Dec 21, 2019 1:45pm
  •  jmflukeiii
  • Joined Oct 2011 | Status: Member | 1,418 Posts
Quoting HiddenGap
Disliked
{quote} I'm curious to see what DonPato has to say, but you are correct. There should be more selling at the low (DELTA) because the sellers are the ones aggressively trading "at the market", while the buyers are passively trading with resting, "limit", orders.
Ignored
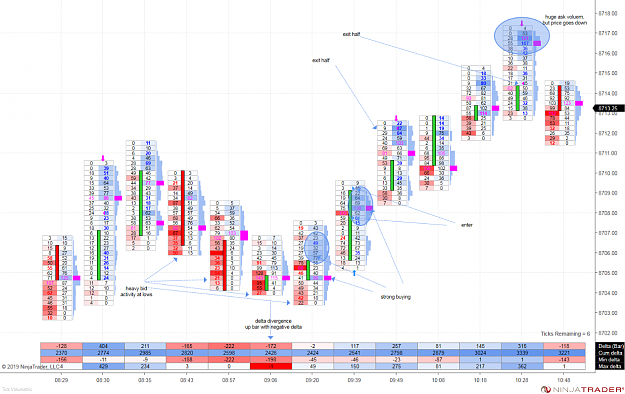
here is a chart from yesterday depicting what I’m normally seeing. Heavy sell delta at lows (absorption), with buy delta beginning to occur once the movement commences in the long direction (i.e. not buy delta near the lows).
Attached Image (click to enlarge)
Click to Enlarge

Name: mnq 03-20 (1000 tick volumetric) 2019_12_20 (10_48_38 am).png
Size: 273 KB
Small disciplines repeated with consistency lead to great achievements.
 
1
  • Post #186
  • Quote
  • Edited 11:12am Dec 22, 2019 10:48am | Edited 11:12am
  •  DonPato
  • Joined Dec 2015 | Status: Member | 1,509 Posts
Hello jmflukeii...I apologize for the delayed response. It is the week end and I am busy with family matters that, of late, have been very pressing. But you have brought up something that I think worthy of study.

Quoting jmflukeiii
Disliked
DP, I’m quoting this post as it contains a chart I’d like some clarity on, purely technical related to how the bars are constructed. I assume the blue horizontal bars are BUY DELTA, red is SELL DELTA. I’m not sure why there are different shades of these two as sometimes the blue bars are longer/wider and darker blue, but sometimes the dark blue are shorter...
Ignored
In my futures trading I use TradeStation with an add on called "OF-G" that creates the profiles...as with many of these softwares, I chose to use the visual profiles rather than the actual order flow numbers...again, I just can't think that fast. So this indicator shows varying shades of blue and red to represent the difference in order flow delta, as a percent of delta. The deeper the color the greater the percent of buying or selling. Deep blue almost all buying, lighter shades of blue less percent of buying (but still overall buying). And grey is a draw - or neutral order flow between the opposing aggression in the market. Agressive buyers (@bid) - Agressive sellers (@sell), with no clear winner...the percent difference is negligible.

As a side note, please don't ask me the math behind these numbers...I honestly don't know, and didn't design the software. And I don't want this to again degrade into a discussion of mathematics, systems, and software. The point of this thread is to "see" the order flow developing in real time and understand what is happening behind the price movements so that we can make more consistently accurate decisions regarding our participation.

Quoting jmflukeiii
Disliked
...The other question I had is: is the delta at each of these price points a diagonal delta or horizontal at that price point?...
Ignored
Yes this is correct. My understanding of the software is that each histogram is "adjusted" 1/2 a tick (bids 0.5 up and asks 0.5 down) to provide an accurate histogram at each level. The actual price levels are literally between the histogram bars. And you can easily confirm this by looking at the areas where my entries and exits occurred. They are "on the line" between the histogram bars.

Quoting jmflukeiii
Disliked
...The first long in your image; I have been watching these bars for awhile now, and I have not seen a bar with such strong buy delta near the lows of a bar (such as where you took your long). So either I’m misunderstanding your chart/how it’s constructed or my profile bars aren’t telling me the same thing as your profile bars...
Ignored
You are not misunderstanding the bars at all. I have a blow up shot of the area you refer to:
Attached Image

The area you refer to was simply a retest of a prior absorption level (call it a shake out) where active buyers were waiting. And this active buying was so intense it neutralized the selling order flow that created that push downward. And this brings up a very good point about using order flow that I was earlier wanting to point out.

Not every low in price is the result of absorption. There are times (like this one) where active buying was simply waiting to jump in. This is especially true of ranging conditions. Often times, the passive participation (absorption) is what causes the halt in price advance (up or down), and after price responds, it price will often return to the same area and this time is lifted by active participation. This occurs mostly because the opposing aggressors (in this case sellers) are stopped out, causing the rise in price, but then are active again at the highs and push price back down to the level where the passive buyers took their positions...this is often called a "stop hunt" or "retest". But it is simply one group of active participants counteracting the order flow of the opposing group of active participants.

Quoting jmflukeiii
Disliked
...Generally I see heavy sell delta at the low of the bars which I see as absorption, but it seems to me that if you see absorption at the low (i.e. heavy Bid volume but price moves up) and then heavy buy delta kicks in (i.e. heavy ask volume with price also moving up), that would be a good sign that not only are passive buyers buying heavy, but buyers (including perhaps the passive buyers that didn’t fill all their passive orders) are having to also now chase price back up as they didn’t fill all their orders at the low....
Ignored
This is accurate and exactly what occurred on this candle. I was watching it form and saw it in real time. When this candle was at the low, it read all red delta...but the candle had not yet fully formed. I saw the red delta change to light red, then to neutral. This level eventually became the Volume Point of Control (VPOC) marked with a round dot. As soon as I saw the neutral order flow, I was ready to trade long, but then price moved below that area, and was met with ALL buying. As soon as I saw that, I entered long...but wasn't quick enough and my order (a market order) was "slipped" a tick or two higher. But I was immediately rewarded and price moved higher...

But price came up just short of my target and once again showed the buying order flow neutralized...and this caused me to Stop and Reverse (SAR) just before the open...in retrospect perhaps not the best decision I've ever made. But I posted that chart because the discussion had turned to the theme of "market manipulation" and this was my response. That YES, there are times when prices can be manipulated by a few ticks by participants with large amounts of money and that often that occurs at the open of a market to "shake out" the weaker players.

But the point I was trying to make in all that was that those players must participate the same way everyone else does, and their order flow will give them away every time. The question is can I read it fast enough to position myself correctly. Each of my first two trades came up short because the price moves were large amounts of money pushing price around but only just enough to use sell stops to position a large group of orders. And that this was occurring so quickly it was very difficult to react to in real time. The one important candle I have marked took only 20 seconds to complete.
Attached Image (click to enlarge)
Click to Enlarge

Name: Screenshot2.png
Size: 73 KB


I hope this accurately answered your questions

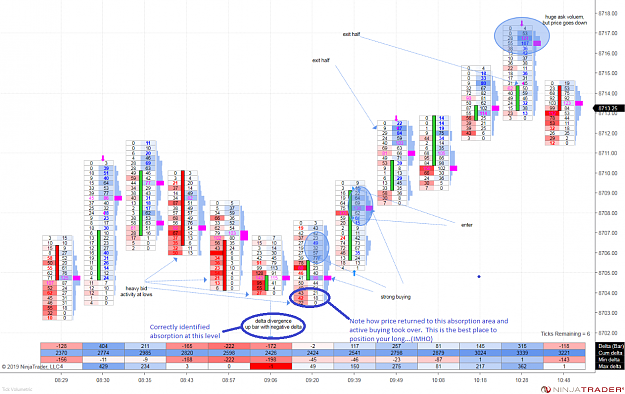
EDIT** I also noted the above described phenomenon occurring on the Ninja trader chart you posted:
Attached Image (click to enlarge)
Click to Enlarge

Name: Screenshot3.png
Size: 287 KB

This is how I try to position when I am trading...IF I can think fast enough
Do more of that which succeeds and less of that which does not - Dennis Gar
 
6
  • Post #187
  • Quote
  • Dec 22, 2019 10:26pm Dec 22, 2019 10:26pm
  •  jmflukeiii
  • Joined Oct 2011 | Status: Member | 1,418 Posts
DonPato, thank you so much for this post. I know it took a lot of time and very much appreciate the detail.
Small disciplines repeated with consistency lead to great achievements.
 
 
  • Post #188
  • Quote
  • Dec 22, 2019 11:00pm Dec 22, 2019 11:00pm
  •  DonPato
  • Joined Dec 2015 | Status: Member | 1,509 Posts
Quoting jmflukeiii
Disliked
DonPato, thank you so much for this post. I know it took a lot of time and very much appreciate the detail.
Ignored
My pleasure...I was up early and couldn't sleep anyway so I decided to put the time to work constructively
Do more of that which succeeds and less of that which does not - Dennis Gar
 
 
  • Post #189
  • Quote
  • Dec 24, 2019 9:10am Dec 24, 2019 9:10am
  •  Rysiek
  • | Joined Jan 2019 | Status: Member | 3 Posts
DonPato
I have read all of your posts made here on forex factory and twice your threads on volume and order flow because you question general beliefs on how the market works - read technical analysis, price action analysis, suckers analysis. I think only people who are looking for deeper why are the ones who make success in this business and they could be successfull in any other scope of activity. Since the beginning of my journey with trading (almost one year) i was searching for something which is deeper than technical analysis. I think this thread and your look on order flow can push me to the next level of thinking. Sometime in the future i will contribute to your work by adding my view on order flow.

Order flow trading is not the strategy or any kind of system but it is just the way of your thinking by looking at charts. Order flow makes a lot of patterns on your charts in any kind of securities which could be use in your trading to your advantage and so to make better trading decisions.

I doubt that threads on order flow could make bigger attention on retail traders on ff because like i said it is not a trading system but a way of thinking and making discrationary decisions and thats much harder than simple indicator strategy.
 
1
  • Post #190
  • Quote
  • Dec 24, 2019 10:29am Dec 24, 2019 10:29am
  •  DonPato
  • Joined Dec 2015 | Status: Member | 1,509 Posts
Quoting Rysiek
Disliked
DonPato I have read all of your posts made here on forex factory and twice your threads on volume and order flow because you question general beliefs on how the market works - read technical analysis, price action analysis, suckers analysis. I think only people who are looking for deeper why are the ones who make success in this business and they could be successfull in any other scope of activity. Since the beginning of my journey with trading (almost one year) i was searching for something which is deeper than technical analysis. I think this...
Ignored
Rysiek...thank you for your kind words and don't look now but you just contributed to this thread.

Yes order flow is somewhat a mindset in that it is not the conventional thinking most are taught when embarking on this business. So it requires us to leave the other "knowledge" aside and start a new. This time with the truth. I put the word "knowledge" in quotes because for someone a long time ago...those technical analysis techniques worked and others started to emulate the winning behavior. But all have now lost sight of the actual structure of the market.

A pit trader never lost sight because he/she WAS part of the structure. However now that trading is online we don't feel or see that structure play out. We are isolated from it. But this structure has never changed since people started exchanging goods and services. It will always be this way because people (no matter their political leanings) are capitalists at heart and will always try to get the "best deal".

Therefore it is incumbent on us who make it our business to trade to do so in the most efficient and effective way possible. For my money that seems obvious. Learning the basics of the market which are (when you really study it to the end) the basics of human behavior, summed up in two words. Greed & fear.

Warren Buffet said it most succinctly, "Learn to be greedy when everyone else is fearful, and fearful when everyone else is greedy".

The concept is simple. The practice...not so much.
Do more of that which succeeds and less of that which does not - Dennis Gar
 
 
  • Post #191
  • Quote
  • Dec 26, 2019 8:45am Dec 26, 2019 8:45am
  •  Rysiek
  • | Joined Jan 2019 | Status: Member | 3 Posts
DonPato

I trade mostly stocks and etfs. I will place one of my trades which were traded form last week till tuesday.

TGS:
Attached Image (click to enlarge)
Click to Enlarge

Name: TGS.png
Size: 36 KB


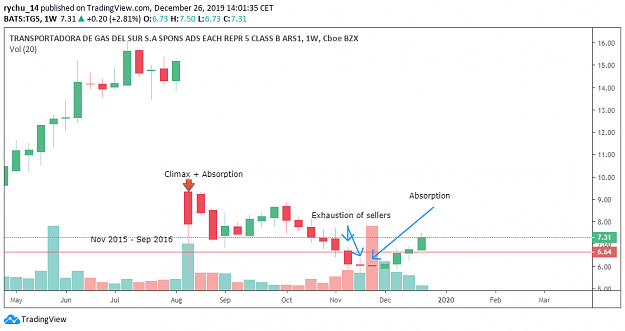
This is a weekly chart. The first bar on 12.08.2019 is climax and absorption bar at once. This is a news bar. Sellers were aggressively selling in a hurry and panic. They found buyers on 6.60 and beneath which was the range last traded between buyers and sellers in the period of november 2015 - september 2016.

From 11 to 22 of november there is an exhaustion phase were late sellers are selling to the buyers. Culmination of this phase is absorption of the sellers from 25 to 29 of november where I see very small range bar with massive volume.

Attached Image (click to enlarge)
Click to Enlarge

Name: TGS1.png
Size: 37 KB


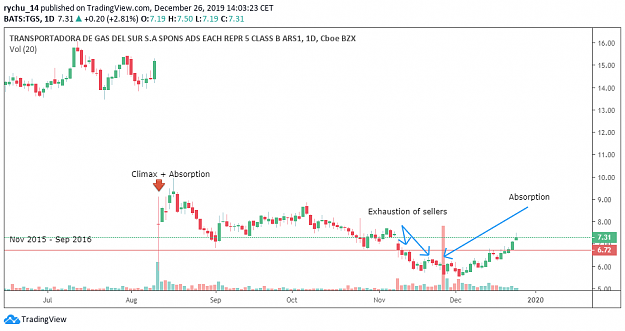
This is a one day chart where I can see that on 26 of november there was massive absorption of the seller by the buyers.

Above Weekly and one day charts gave me a context and wider scenario of my trade which was traded on 1 hour and 15 minute charts.

Attached Image (click to enlarge)
Click to Enlarge

Name: TGS2.png
Size: 31 KB


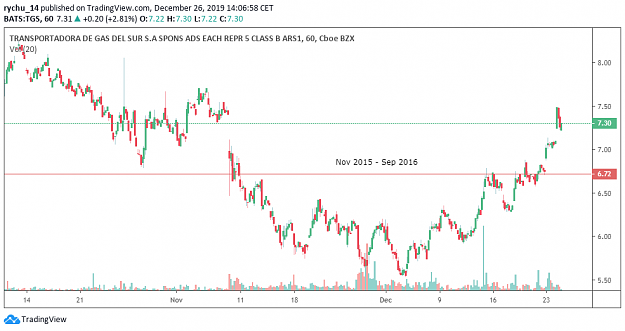
This is one hour chart. I put the red line to know on what price level buyers overcame seller last time. This red line was formed from september 2015 to november 2016. I can see that beneath this level buyers are taking stocks from the sellers. This level is again the bastion of sellers which were overthrown by buyers.

Transactions between buyers and seller, which are made by putting orders and causing the order flow, are seen on the chart by formating a pattern. This pattern is symmetric, volatile and make attention of market participants including me. DonPato do you see the pattern?

Attached Image (click to enlarge)
Click to Enlarge

Name: TGS3.png
Size: 38 KB


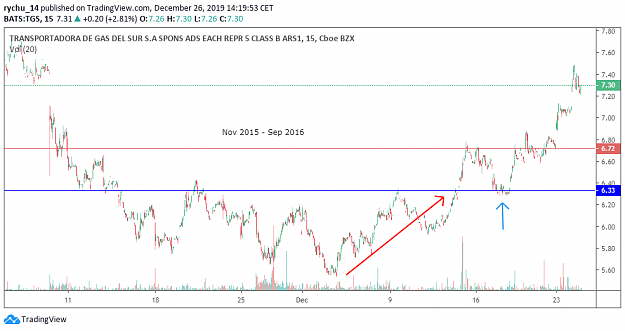
This is a 15 minutes chart which is crucial for me to take a trade.
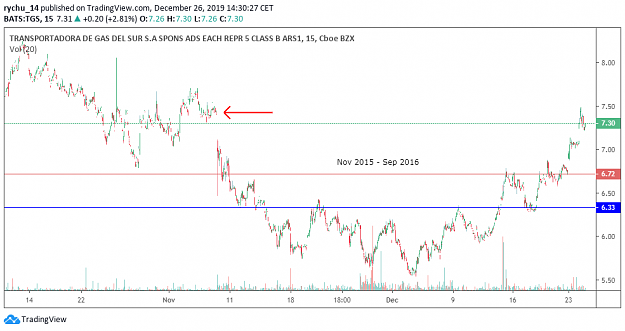
By blue horizontal line i sign the most recent area where sellers are selling the stocks. I am waiting for a moment where buyers will beat the sellers in their game causing stop loss cascade.
Bye red arrow i mark the last action of the buyers in an attempt to beat the sellers and activate their stop losses.
The sellers were finally beaten and their stop losses activated.
The price went to the red horizontal line mantioned above where sellers again felt strong. They push the price to the blue horizontal line where now is the stronghold of buyers.
By blue arrow i mark the strength of buyers which defended their level. This was my enter.

Attached Image (click to enlarge)
Click to Enlarge

Name: TGS4.png
Size: 35 KB


By red arrow i mark the level 7.43 which was my target level. I wanted buyers to buy the stocks till they will fill the gap. By gap i mean lack of liquidity and sellers. This level is closly watched by everybody. Firstly by early buyers including me which set their price target on that level, secondly by late buyers who wanted to buy after breakout of the gap (suckers who think by technical analysis. Probably all their indicators now are sending alerts to buy), thirdly by sellers who like to play short.

Above I mantioned about the pattern. This pattern occur in every time frame every day NOT in every stock but in enough to make money.

This is my analysis after one year of trying to understand the market. After reading your thread i will try to connect your footprints with my patterns in order to be more precise and extend my edge over other participants of the market.
 
2
  • Post #192
  • Quote
  • Edited Dec 27, 2019 11:11am Dec 26, 2019 11:27am | Edited Dec 27, 2019 11:11am
  •  DonPato
  • Joined Dec 2015 | Status: Member | 1,509 Posts
Quoting Rysiek
Disliked
DonPato... After reading your thread i will try to connect your footprints with my patterns in order to be more precise and extend my edge over other participants of the market.
Ignored
Rysiek...I didn't quote your entire post but wanted to congratulate you on a very well thought out analysis. This is the kind of reasoning I see in my students who finally start to see the market as it really is. Not just price movement or graphs but participants acting on their beliefs and using their actions to create order flow.

But you didn't just stop at the intellectual exercise you acted on it and made a successful trade. THIS is the whole point. It is not a mathematical edge it is a mental edge.

Well done!! I hope you will continue to see things more clearly from now on.
Do more of that which succeeds and less of that which does not - Dennis Gar
 
2
  • Post #193
  • Quote
  • Dec 28, 2019 7:34pm Dec 28, 2019 7:34pm
  •  GreyPool
  • Joined Dec 2019 | Status: Member | 91 Posts
Order book activity is the next frontier, it's something I'm just getting into now and trying to apply to my trading. Our group is currently scraping order book trade activity for the few symbols we're auto trading and using it for more accurate backtesting - this way when we run the backtest we can get an accurate representation of where our orders would've been filled

Quoting DonPato
Disliked
Hello jmflukeii...I apologize for the delayed response. It is the week end and I am busy with family matters that, of late, have been very pressing. But you have brought up something that I think worthy of study. {quote} In my futures trading I use TradeStation with an add on called "OF-G" that creates the profiles...as with many of these softwares, I chose to use the visual profiles rather than the actual order flow numbers...again, I just can't think that fast. So this indicator shows varying shades of blue and red to represent the difference...
Ignored
 
 
  • Post #194
  • Quote
  • Dec 30, 2019 10:59am Dec 30, 2019 10:59am
  •  DonPato
  • Joined Dec 2015 | Status: Member | 1,509 Posts
Quoting GreyPool
Disliked
Order book activity is the next frontier, it's something I'm just getting into now and trying to apply to my trading. ...
Ignored
While i have no interest in automating my trading at this time, I am curious about this "next frontier" you mention. As I understand it, the order book is a broker specific list of customer liquidity available at each level. It is NOT the general liquidity available in the market as a whole, but broker specific. (The Bucket - in the bucket shop).

So a number of questions some to mind:

  1. How does one gain access to this data? To my knowledge the broker's order book is only available to the broker.
  2. Does this information extend beyond the usual 10-15 ticks above and below the quoted price? In other words I can look at the available liquidity in my futures account and see it but only a standard 10 ticks above and below the quoted price.
  3. Does the phrase "Order Book Activity" mean changes to the unused liquidity before price reaches a certain level? Or does it simply mean liquidity availability at the quoted price...which we can already see in price movements and order flow.
  4. Is this data truly the entire market or simply broker specific? AND
  5. If it is broker specific how can you even think to be able to capture the data of the entire market with first opening an account in each and every brokerage firm?
  6. Finally, how do changes in un-used liquidity effect price movements at the quoted price? I can certainly see how changes might effect price ONCE it reaches that level, but that must also assume price is moving the direction of the changes...or is this just another way of "spoofing" the order flow to move price up or down a few ticks?

Can you answer these questions?

Do more of that which succeeds and less of that which does not - Dennis Gar
 
 
  • Post #195
  • Quote
  • Dec 30, 2019 11:45am Dec 30, 2019 11:45am
  •  GreyPool
  • Joined Dec 2019 | Status: Member | 91 Posts
1. I was referring to crypto exchange order book data specifically which is currently available via several data aggregation services.

2. The data can extend to 100 levels above/below the quoted price

3. The real value in looking at the "Order Book Activity" in my opinion is analyzing it algorithmically to look for patterns, or in the case of a strategy I'm currently interested in, calculating a more accurate median price based off the current short/long activity in the order book by the second and trading in that direction presuming that price will always normalize. There's an interesting research article about this that I'll refer you to if you DM me.

4. It's broker specific, but in the case of the Crypto market, most of the trading activity is pooled in a group of a few exchanges.

5. It's a pretty good bet we can capture the data of 90% of the market pretty easily by focusing on the exchanges with the top 10 most trading volume

6. Imagine there is a large block bid order in the book, depending on how frequently and in which sizes the orders chip away at it there is a possibility of determining, within a reasonable degree of certainty (the model I've seen says 70%) whether price will rebound from that level and by how much.

I'd cite the research paper I'm thinking of here but I'm wary of being banned for posting a link.

There are very few people looking at the dynamics of order books in the crypto market currently and there are many opportunities to profit by analyzing the patterns within this data. I've yet implement this into any of my strategies but I'm looking forward to learning more.


Quoting DonPato
Disliked
{quote} While i have no interest in automating my trading at this time, I am curious about this "next frontier" you mention. As I understand it, the order book is a broker specific list of customer liquidity available at each level. It is NOT the general liquidity available in the market as a whole, but broker specific. (The Bucket - in the bucket shop). So a number of questions some to mind: How does one gain access to this data? To my knowledge the broker's order book is only available to the broker. Does this information extend beyond the usual...
Ignored
 
 
  • Post #196
  • Quote
  • Dec 30, 2019 12:46pm Dec 30, 2019 12:46pm
  •  DonPato
  • Joined Dec 2015 | Status: Member | 1,509 Posts
I'm not a crypto trader but for those who are I can see how this might be of interest. However, as before I would like to invite you to comment on our current conversation of order flow and how we can use that to trade...

I personally believe that trading is trading and that it can be done universally no matter which market you trade. However, when I see something become specific to only one market, I become caution that it is "too specialized" because the more you make something specific to a single market the more likely (IMO) it is to fail if the conditions change.

Just my opinion however, each of us is unique and if this works for you...have at it.
Do more of that which succeeds and less of that which does not - Dennis Gar
 
1
  • Post #197
  • Quote
  • Dec 31, 2019 1:19am Dec 31, 2019 1:19am
  •  Emma1
  • | Joined May 2015 | Status: Member | 88 Posts
Quoting DonPato
Disliked
{quote} This is the perfect segue into point #3 above: (3) These orders are matched with each other at agreed upon prices buys with sells until the liquidity at a particular price is gone. Then price will move higher (or lower) depending on the surplus of orders remaining unfilled. (Higher with more buying, and lower with more selling). Now that we know the basic difference between order types, passive vs aggressive, we can start to put thing together to show how order flow/volume actually moves prices. First, a confession. I am a "visual learner"...
Ignored


Please, is there a particular tool used here?
 
1
  • Post #198
  • Quote
  • Dec 31, 2019 8:36am Dec 31, 2019 8:36am
  •  DonPato
  • Joined Dec 2015 | Status: Member | 1,509 Posts
Quoting Emma1
Disliked
{quote} Please, is there a particular tool used here?
Ignored
I'm not sure I understand what you are asking. The post you quote is simply an explanation of liquidity. Are you looking for a tool to see market depth?
Do more of that which succeeds and less of that which does not - Dennis Gar
 
 
  • Post #199
  • Quote
  • Dec 31, 2019 8:51am Dec 31, 2019 8:51am
  •  hefei
  • | Joined Aug 2019 | Status: learning | 52 Posts
Hello, Don
Is there any further discussions about order flow in the future in this thread? seems that the basic concepts/discussion on order flow/volume has been taught already.
learning...
 
 
  • Post #200
  • Quote
  • Dec 31, 2019 10:19am Dec 31, 2019 10:19am
  •  DonPato
  • Joined Dec 2015 | Status: Member | 1,509 Posts
Quoting hefei
Disliked
Hello, Don Is there any further discussions about order flow in the future in this thread? seems that the basic concepts/discussion on order flow/volume has been taught already.
Ignored
As I have mentioned in earlier posts, I am waiting for questions...do you have one? I believe I also mentioned that due to family issues my time for posting (just to post) is very limited. I am happy to answer questions, but will not be able to just hang out on the forum.
Do more of that which succeeds and less of that which does not - Dennis Gar
 
 
  • Trading Discussion
  • /
  • Discussions on Order Flow/Volume
  • Reply to Thread
    • 1 89Page 101112 26
    • 1 9Page 1011 26
0 traders viewing now
  • More
Top of Page
  • Facebook
  • Twitter
About FF
  • Mission
  • Products
  • User Guide
  • Media Kit
  • Blog
  • Contact
FF Products
  • Forums
  • Trades
  • Calendar
  • News
  • Market
  • Brokers
  • Trade Explorer
FF Website
  • Homepage
  • Search
  • Members
  • Report a Bug
Follow FF
  • Facebook
  • Twitter

FF Sister Sites:

  • Metals Mine
  • Energy EXCH
  • Crypto Craft

Forex Factory® is a brand of Fair Economy, Inc.

Terms of Service / ©2023