• Home
  • Forums
  • Trades
  • News
  • Calendar
  • Market
  • Brokers
  • Login
  • Join
  • 3:13pm
Menu
  • Forums
  • Trades
  • News
  • Calendar
  • Market
  • Brokers
  • Login
  • Join
  • 3:13pm
Sister Sites
  • Metals Mine
  • Energy EXCH
  • Crypto Craft

Options

Bookmark Thread

First Page First Unread Last Page Last Post

Print Thread

Similar Threads

Fundamental Analysis, Technical Analysis Or Graph Analysis? 28 replies

EUR/USD - Analysis of daily Price movement 7 replies

Using usd/chf - eur/usd correlation to see moves in EUR/USD 46 replies

Where i can find daily analysis about EUR/USD pair? 4 replies

GBP/USD daily pip movement vs. EUR/USD daily pip movement 3 replies

  • Trading Journals
  • /
  • Reply to Thread
  • Subscribe
  • 3
Attachments: Daily EUR/USD Analysis with GBLilleyUSMC
Exit Attachments
Tags: Daily EUR/USD Analysis with GBLilleyUSMC
Cancel

Daily EUR/USD Analysis with GBLilleyUSMC

  • Post #1
  • Quote
  • First Post: Jul 14, 2008 5:21pm Jul 14, 2008 5:21pm
  •  GBLilleyUSMC
  • | Joined Nov 2007 | Status: Member | 5 Posts
Analysis Current 3:04 PM CST

Tomorrow is really going to be akin to walking through a mine field all the way from the London session through New York. There are multiple economic announcements that could seriously move the market.

GBP has CPI y/y being released at 3:30 AM CST. EUR has the German ZEW Economic Sentiment at 4:00 AM CST. The USD has Core Retail Sales m/m, PPI m/m, and Retail Sales m/m being released at 7:30 AM CST and to top it all off, the icing on the cake is Fed Chairman Bernake’s testimony at 9:00 AM CST.

I would not underestimate the market moving potential of a single event listed above. They all have the potential to move the market if there are any surprises. SURPRISE? In Forex? No way man!

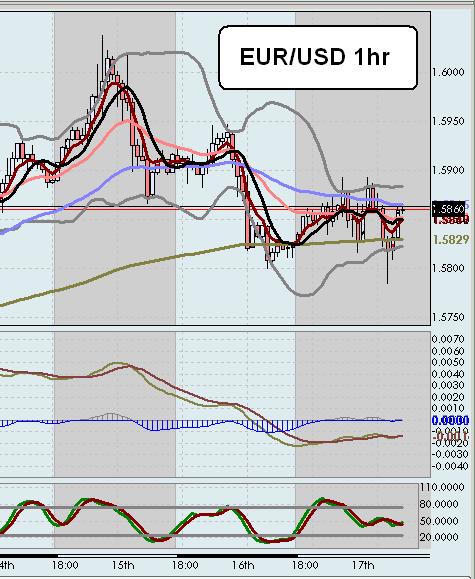
Today there was a movement down to the 61.8% retracement of the last major move up on the hourly chart. Price reversed there and has ended up not significantly far away from where it left off on Friday. More or less, I figured price would not accomplish anything significant before the major news releases in the middle of the week. I am still waiting on a news catalyst to bring us to new highs or slam us down where we came from.

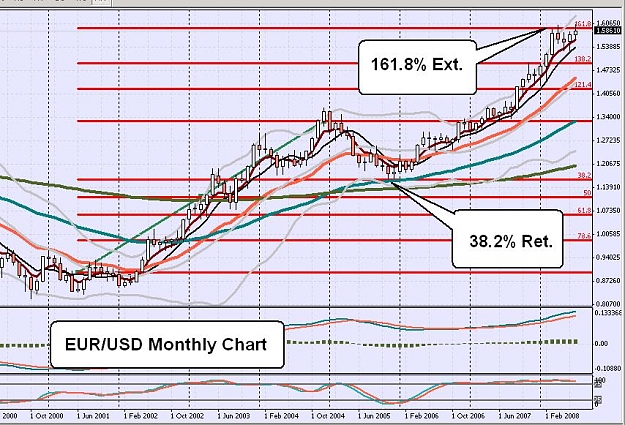
It can clearly be seen on the daily chart that we popped up above the upper ascending trend line that was just below 1.6000 when price gapped up on Sunday afternoon.

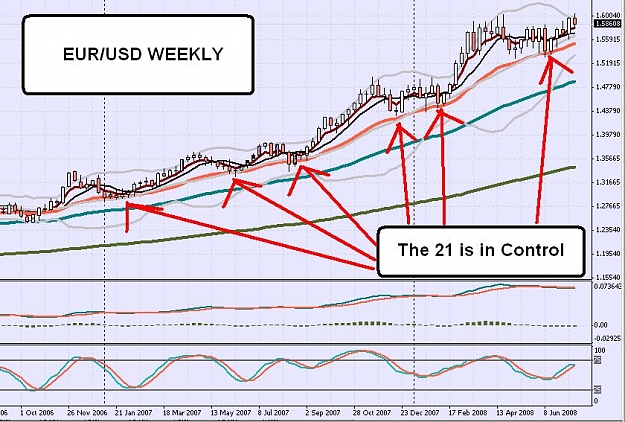
We still have a 21/55 cross to the upside on the hourly chart, price is still above it; however the EMA is starting to flatten out which is much weaker than an EMA screaming up or down. The 1hr 5/8 is threatening to cross down right above the 21. MACD tried to cross to the upside and stochastic is overbought and just starting to cross down. We are overall still above the 200 EMA.

1.5866 is still support to the downside, and of course the 1.6000 level still looms above us. If we can break 1.6000 that will be a new all time high (at least as far back as my charts go), and will pretty much be in uncharted territory. 1.5800 will be the next level after 1.5866 on the way down.

I would submit that the 21 EMA has already lost control of price on the hourly chart and the only hope between here and the 200 will be the 55 which doesn’t usually put up much of a fight for very long. Today the bounce off of that 61.8% level could be considered a bounce off of the hourly 55 as well.

The real question this week is going to be which way are the fundamentals going to take us? What will the Fed say that could impact the Dollar? What about the rest of the news releases? All of this will play a major factor this week. It may be hard to find good technical moves tomorrow and Wednesday. Thursday and Friday have the potential to be big days though in my opinion.

Technically, I have a downward bias; however, it would be crazy to try and pick a direction here at this critical decision point with all of these potentially market moving releases coming up. My official direction is, “Wait and see” again.


If you don't understand the indicators I use or the reasons behind them, visit my blog where they are explained in detail.
  • Post #2
  • Quote
  • Edited Jul 16, 2008 1:46am Jul 15, 2008 1:43pm | Edited Jul 16, 2008 1:46am
  •  CTGUY
  • | Membership Revoked | Joined Jun 2008 | 914 Posts
Here is a good link to add your message to: http://www.forexfactory.com/showthread.php?t=2674

Thank you for your Service to Our Country.

Outstanding blog by the way... looks great!

Good Luck.
"To Be A Successful Forex Trader, You Need A Successful Forex Mentor."
 
 
  • Post #3
  • Quote
  • Jul 16, 2008 8:39pm Jul 16, 2008 8:39pm
  •  GBLilleyUSMC
  • | Joined Nov 2007 | Status: Member | 5 Posts
CTGUY, Thanks so much for your reply. Not sure what that link is supposed to do though. I appreciate you looking at my blog!


Here's my analysis for today

Analysis Current 4:09 PM CST

Tomorrow we will finally have a London session that is light on news, so we may have some good technical moves. During the New York session, Building Permits for the USD will be released at 7:30 AM Central Standard Time.

Economic announcements provided by: www.forexfactory.com

Well, it looks like the head and shoulders pattern I discussed yesterday has formed up now, and it is a beaut! Its one of the most anatomically correct H&S patterns that I have seen in a while. However, the top of the right shoulder topped 10 pips below where I predicted. We bottomed today at 1.5800 which is an important psychological level. I would expect some type of retracement here at this level, most likely somewhere between 1.5873 and 1.5856. We could get this during an Asian fade, then make a continuation back to the downside where I would be watchful for a double bottom at 1.5800. As usual if we break the 1.5800 level, I will be looking for a break then retest of this level.

Today we initiated a 21/55 cross to the downside on the hourly. I would say that this is very significant. Currently, the 5/8 is still pointed down and has broken the 200 EMA. Bollinger bands are still wide open despite the time of day. MACD is still pointing down and stochastics is locked in oversold territory. Generally, if we are trending in a strong move, I will look more at MACD because of stochastics tendency to lock below the trading zone levels during major trends.

If we can break the 1.5800 level, the next area of support will be 1.5774 which is the 61.8% retracement level of the last major swing up, then 15738 which has been respected as valid S&R in the past. If we head back up, we will have to break back through the 1.5860 level, then the dynamic resistance offered by the top of the trend line we were in before the top of the H&S formed up should offer resistance.

On the hourly chart, we are basically in a ride the 5 scenario (where price stays above or below the 5 ema, this shows a strong move.) However the 5/8 is starting to lose angle and separation. It may cross back up temporarily while we respect this 1.5800 level. Since we just had a fresh cross of the 21/55 EMAs I would not be surprised at all to see price return to check in with the 21 EMA and make sure its still there before heading back down.

We also broke the weekly central pivot point today which is at 1.5830. If price can stay below this level that would be bearish according to pivot point theory.

Everything is pretty much telling me short on this pair today. However I do believe that we are in line for a retracement to that 1.5850 - 1.5870 area. I will be watching 1.5800 closely for a bounce or break and retest with continuation to the downside.
 
 
  • Post #4
  • Quote
  • Jul 17, 2008 5:56pm Jul 17, 2008 5:56pm
  •  GBLilleyUSMC
  • | Joined Nov 2007 | Status: Member | 5 Posts
Economic Releases:
News for looks extremely light on Forex Factory. There are only two releases pulling up at this time that even show in the orange. The only one that I think could possibly bring us trouble would be the month on month German producers price index being released at 1:00 AM CST.

Long term analysis:
We have executed what I would count as a double top on the daily chart. And the 5/8 is trying its best to cross right here. The area that this pair has double topped is important since it is more or less the 161.8 % Fibonacci extension of the move up from June of 2001 to January of 2005. Price then hit a 38.2% Fibonacci retracement. The appropriate target for a 38.2% fib is the 161.8% extension which lies more or less right around the 1.6000 level.

Price seems to have simply stalled around the 1.5800 level which is very close to the 50% retracement level from the move up from 7/7/08 to 7/15/08. Price action does not look interested in bouncing here. It looks more like it may hang here for a bit before dropping down again.

Hourly Indicators:
We still have our 21/55 and 5/8 crosses to the downside. Price also seemed to be reacting to the 200 EMA today which is around 1.5829. Our hourly MACD has been more or less just playing around today. I would not trust it for any direction when it is acting like this, it is basically braiding. (Braiding is where 2 EMAs cross and recross continually and this shows lack of market direction.) Braiding is a good indicator not to trade.

Support and Resistance levels:
Today we have been ranging between 1.5809 and 1.5894. There is ascending dynamic resistance currently at 1.5790 then at 1.5733 that should offer support to the downside. Resistance should be found at 1.5937 then 1.6000 to the upside. So there are a couple of dynamic levels that I would like to see us break through before we can have a serious move to the downside. It may take us a few days to get through these levels.

Moving Average Control:

Its easy to see that we are in a consolidation period when you start to look for an EMA that truly has control of price and cannot find one until you get to the Weekly chart. The Weekly 21 EMA is the only EMA on the hourly chart or above that has clear control over price. It lies at 1.5524, so that will be an area to watch when we get there.

Overall bias:
My overall bias on this pair is short; however, I think that we still have some serious levels to contend with on the way down before we can consider this pair in a downtrend.

If you don't understand which indicators I use or why I use them, visit my blog.
Attached Image(s) (click to enlarge)
Click to Enlarge

Name: Monthly fib ext 71708.JPG
Size: 121 KB
Click to Enlarge

Name: EURUSD WK 21 71708.JPG
Size: 95 KB
Attached Image
 
 
  • Post #5
  • Quote
  • Last Post: Jul 29, 2008 5:21pm Jul 29, 2008 5:21pm
  •  GBLilleyUSMC
  • | Joined Nov 2007 | Status: Member | 5 Posts
Well, it was a very nice down day indeed wasn’t it? It is definitely the way things were pointed yesterday. I don’t think there was anyone out there really surprised by this drop at all. If you were surprised, look over yesterdays post and review what was talked about.

Tomorrow it appears that we will be light on London news. New York will have the ADP Non-Farm Employment change for us at 7:15 AM CST. Any surprising data here can certainly move the market but I would not really look for it to be a crystal ball into what Non-Farm Payrolls will hold on Friday.

Guess what we hit today folks?!?! The Weekly 21 EMA that I have been talking about for about a week now, we have arrived. Now the million dollar question is, “Can we break it?” Well, the correct answer is, “I don’t know.” We always assume that support and resistance will hold until it is proven broken. But, lets break down what we have here. We have a very clear top at the 1.6000 level that price just refused to break. We have MACD in the negative and gaining angle and separation on the weekly chart. We also have slight MACD divergence on the Weekly chart, and even slight divergence on a weekly chart is very important. So I think if we are going to break the 21, this is the most likely time for us to do it.

On analysis of the hourly chart, to day pretty much looks like a vertical red line. What do we do now? The right thing to do is wait for some type of retracement then confirmation of a continuation. Blindly shorting here could get ugly if we have some serious sellers remorse. However, with the power of this move down we had today, I would not be surprised if we don’t see a Class A retracement during the Asian session. We may just see some sideways action or a very slight retracement with a continuation to the downside tomorrow.

My overall bias for tomorrow has to be short; BUT, with us at the weekly 21, I will be cautious. We may see some ranging or chop trying to break a huge level like that so don’t be surprised. Or we could just blast on down. Whatever you do, wait for confirmation, follow your own system, never price chase and never break your own rules.
 
 
  • Trading Journals
  • /
  • Daily EUR/USD Analysis with GBLilleyUSMC
  • Reply to Thread
0 traders viewing now
Top of Page
  • Facebook
  • Twitter
About FF
  • Mission
  • Products
  • User Guide
  • Media Kit
  • Blog
  • Contact
FF Products
  • Forums
  • Trades
  • Calendar
  • News
  • Market
  • Brokers
  • Trade Explorer
FF Website
  • Homepage
  • Search
  • Members
  • Report a Bug
Follow FF
  • Facebook
  • Twitter

FF Sister Sites:

  • Metals Mine
  • Energy EXCH
  • Crypto Craft

Forex Factory® is a brand of Fair Economy, Inc.

Terms of Service / ©2023