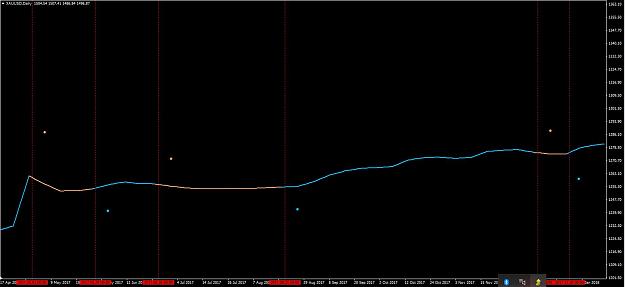
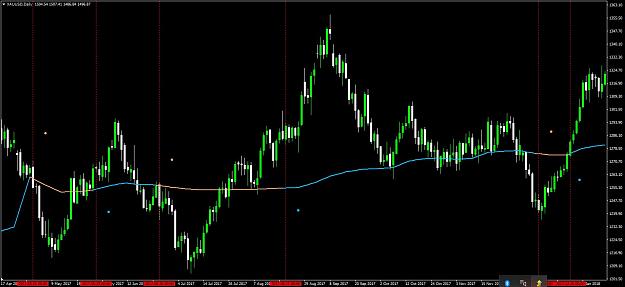
• Home
  • Forums
  • Trades
  • News
  • Calendar
  • Market
  • Brokers
  • Login
  • Join
  • User/Email: Password:
  • 12:45am
Menu
  • Forums
  • Trades
  • News
  • Calendar
  • Market
  • Brokers
  • Login
  • Join
  • 12:45am
Sister Sites
  • Metals Mine
  • Energy EXCH
  • Crypto Craft

Options

Bookmark Thread

First Page First Unread Last Page Last Post

Printable Version

Similar Threads

TMA+CG mladen indicator 3 replies

MA, Gann and Ichimoku system (profitable system!) 60 replies

Very Profitable System - Roi system 349 replies

ECN && STP && Scalping && Hedging - Broker Review - Oct 2009 24 replies

Trading Made Simple system follower - Thanks to eelfranz 9 replies

  • Trading Systems
  • /
  • Reply to Thread
  • Subscribe
  • 163
Attachments: Thanks Mladen & Mrtools (profitable system with 2 indicators)
Exit Attachments

Thanks Mladen & Mrtools (profitable system with 2 indicators)

  • Last Post
  •  
  • 1 23Page 456 15
  • 1 3Page 45 15
  •  
  • Post #61
  • Quote
  • Sep 29, 2019 7:49am Sep 29, 2019 7:49am
  •  jimsxxl
  • | Joined Oct 2016 | Status: Member | 74 Posts
Quoting DrDave
Disliked
{quote} I don't know exactly what you want to check on the EA, but using a piece of the previously posted D1 chart with W1 dots, the rectangles represent the W1 bar that is painted by the 5 D1 bars that it encloses. Note the red dot is displayed only after the W1 bar is CLOSED. Likewise, the blue dot is displayed only after the W1 bar is CLOSED. So your trade is now (hopefully) riding the D1 bars until a bar of opposite color is closed or a dot of opposite color is displayed. {image} The frist rectangle from the left is a red W1 rectangle/bar because...
Ignored
Thanks DrDave for the explanation.
So, to clarify....when the first D1 bar opens, in the second red/blue rectangles you have drawn, the dot is already there?

it is NOT the second red/blue rectangle that draws the dot ?
  • Post #62
  • Quote
  • Edited at 9:54am Sep 29, 2019 8:18am | Edited at 9:54am
  •  DrDave
  • Joined Jun 2011 | Status: MEMBER: Temporary Suspension | 3,938 Posts
Quoting jimsxxl
Disliked
{quote} Thanks DrDave for the explanation. So, to clarify....when the first D1 bar opens, in the second red/blue rectangles you have drawn, the dot is already there? it is NOT the second red/blue rectangle that draws the dot ?
Ignored
I loaded the frama dots indicator on H1 and set it for H4. I looked very closely at both H1 and H4 charts for how the lines and dots are drawn. The logic for placing the dot was not what I was expecting, so I made a close study of how it is drawn.

From what I can see, the dot drawn on H1 is the BEGINNING of a new H4 bar. Therefore, the dot is signaling something occurred at the close of the last H4 bar (which corresponds to the close of the preceding H1 bar as well). This "something" appears to be the crossing of the frama lines. So this dot on H1 is displaying a confirmation that the just closed H4 bar had the lines cross and is the signal for immediate entry. (Typically, I see signal bars coded to have the indicator drawn on the closed signal bar rather than on the open of the following entry bar.)
The markets are speaking to you. Do you know their language?
IMT Pips This Year: 110
1
  • Post #63
  • Quote
  • Sep 29, 2019 10:14am Sep 29, 2019 10:14am
  •  jimsxxl
  • | Joined Oct 2016 | Status: Member | 74 Posts
Quoting DrDave
Disliked
{quote} I loaded the frama dots indicator on H1 and set it for H4. I looked very closely at both H1 and H4 charts for how the lines and dots are drawn. The logic for placing the dot was not what I was expecting, so I made a close study of how it is drawn. From what I can see, the dot drawn on H1 is the BEGINNING of a new H4 bar. Therefore, the dot is signaling something occurred at the close of the last H4 bar (which corresponds to the close of the preceding H1 bar as well). This "something" appears to be the crossing of the frama lines. So this...
Ignored
Hey again Dave
Yes, i did a fast check aswell and saw the same thing.
The close of the candle on the higher timeframe generates the dot
1
  • Post #64
  • Quote
  • Sep 29, 2019 10:32am Sep 29, 2019 10:32am
  •  DrDave
  • Joined Jun 2011 | Status: MEMBER: Temporary Suspension | 3,938 Posts
Quoting jimsxxl
Disliked
{quote} Hey again Dave Yes, i did a fast check aswell and saw the same thing. The close of the candle on the higher timeframe generates the dot
Ignored
Yes. And for this system, the dot is the TRIGGER to enter. On most systems, the dot would have been placed over the closed candle on the higher timeframe rather than above the new candle that is forming.
The markets are speaking to you. Do you know their language?
IMT Pips This Year: 110
1
  • Post #65
  • Quote
  • Sep 29, 2019 10:51am Sep 29, 2019 10:51am
  •  johnsmith2nd
  • Joined Jan 2017 | Status: Member | 528 Posts
Quoting heispark
Disliked
There are two mistakes: 1. You don't under estimate the market. There's no simple or easy trading method. 2. You don't expose your edge. This is zero sum game and market will quickly neutralize your edge.
Ignored
Edge? There is no such thing.... you are not competing against other traders, or the market.. you are trading in agreement with the market. All this "you need to find an edge malarky" sends people down the rabbit hole. All you need is discipline, consistency and patience (on-top of your trading system).. you can call those 'edge' if you want, but they're not.

anyway, good thread, i'm following and will test this out.
3
  • Post #66
  • Quote
  • Edited at 12:24pm Sep 29, 2019 12:05pm | Edited at 12:24pm
  •  cfudge
  • Joined Apr 2013 | Status: Member | 1,158 Posts
Nice observation DrDave, jimsxxl

This is great news...the earlier the signal the better, of course.

I wonder if the namesakes for this thread could shed some light on this...

I would like to know how you observed this, when markets are closed. Was it with the tester?

Chris

@DrDave

I don't have a great deal of time this week to run a test like you suggested (post 60)...with the weekly close, do you have any preliminary results?
  • Post #67
  • Quote
  • Sep 29, 2019 2:55pm Sep 29, 2019 2:55pm
  •  DrDave
  • Joined Jun 2011 | Status: MEMBER: Temporary Suspension | 3,938 Posts
Quoting cfudge
Disliked
Nice observation DrDave, jimsxxl This is great news...the earlier the signal the better, of course. I wonder if the namesakes for this thread could shed some light on this... I would like to know how you observed this, when markets are closed. Was it with the tester? Chris @DrDave I don't have a great deal of time this week to run a test like you suggested (post 60)...with the weekly close, do you have any preliminary results?
Ignored
Sorry, but no. Maybe I will be able to make a check on H4/H1 pair.
The markets are speaking to you. Do you know their language?
IMT Pips This Year: 110
1
  • Post #68
  • Quote
  • Sep 29, 2019 3:13pm Sep 29, 2019 3:13pm
  •  cfudge
  • Joined Apr 2013 | Status: Member | 1,158 Posts
I asked Mrtools about the printing of the Frama Ribbon dots, in MTF mode.

Attached Image (click to enlarge)
Click to Enlarge

Name: question answer.jpg
Size: 57 KB

Attached Image (click to enlarge)
Click to Enlarge

Name: charts.jpg
Size: 53 KB
1
  • Post #69
  • Quote
  • Sep 29, 2019 3:22pm Sep 29, 2019 3:22pm
  •  cfudge
  • Joined Apr 2013 | Status: Member | 1,158 Posts
Here is a chart with red dotted lines showing where the dots were with "Arrow on first MTF bar" set to true.

The dots, as you see them now, are with it set to false.

Attached Image (click to enlarge)
Click to Enlarge

Name: frama dots.jpg
Size: 69 KB


With candles...

Attached Image (click to enlarge)
Click to Enlarge

Name: frama dots candles.jpg
Size: 108 KB
2
  • Post #70
  • Quote
  • Sep 29, 2019 3:53pm Sep 29, 2019 3:53pm
  •  johnsmith2nd
  • Joined Jan 2017 | Status: Member | 528 Posts
Quoting cfudge
Disliked
Here is a chart with red dotted lines showing where the dots were with "Arrow on first MTF bar" set to true. The dots, as you see them now, are with it set to false. {image} With candles... {image}
Ignored
Nice observation. No signals for exit however, but you could factor in S/R for your SL or TP possibly. Look forward to your continued observations and development.
  • Post #71
  • Quote
  • Sep 29, 2019 5:04pm Sep 29, 2019 5:04pm
  •  cfudge
  • Joined Apr 2013 | Status: Member | 1,158 Posts
Quoting johnsmith2nd
Disliked
{quote} Nice observation. No signals for exit however, but you could factor in S/R for your SL or TP possibly. Look forward to your continued observations and development.
Ignored
Exit criteria is in post #1
  • Post #72
  • Quote
  • Sep 29, 2019 5:40pm Sep 29, 2019 5:40pm
  •  cfudge
  • Joined Apr 2013 | Status: Member | 1,158 Posts
Here are the 6 charts setup for trading.

3 daily charts (on top)
3 4hour charts (on bottom)

Two trades entered at opening.

GL daily short
AN 4hr long

Already the dot on GJ has disappeared. I am going to trade this on every dot, so if at the close of the last daily/weekly candle we see a dot I will trade it. Let's see where we get.

Chris

Attached Image (click to enlarge)
Click to Enlarge

Name: charts setup.jpg
Size: 251 KB


PS; The templates do not seem to work for me, not sure why???
If you +/- candle size the xSuperTrend does not show the candle colour properly, You have to turn "Auto adjust candle body" to false, close the set file window,
re-open it and set it back to true to fix it.
1
  • Post #73
  • Quote
  • Sep 29, 2019 6:12pm Sep 29, 2019 6:12pm
  •  aaven
  • Joined Jul 2015 | Status: Member | 2,260 Posts
Quoting cfudge
Disliked
Here are the 6 charts setup for trading. 3 daily charts (on top) 3 4hour charts (on bottom) Two trades entered at opening. GL daily short AN 4hr long Already the dot on GJ has disappeared. I am going to trade this on every dot, so if at the close of the last daily/weekly candle we see a dot I will trade it. Let's see where we get. Chris {image} PS; The templates do not seem to work for me, not sure why??? If you +/- candle size the xSuperTrend does not show the candle colour properly, You have to turn "Auto adjust candle body" to false, close the...
Ignored
Yes Chris- The templates for some reason are not working...
1
  • Post #74
  • Quote
  • Sep 29, 2019 6:57pm Sep 29, 2019 6:57pm
  •  cfudge
  • Joined Apr 2013 | Status: Member | 1,158 Posts
If you want the setfiles for the 3 daily charts go to posts 22 29 30

If you want the setfiles for the 3 4hr charts go to post 47

These are all for the xsupertrend indicator

The frama ribbon set files are all the same as post 1
1
  • Post #75
  • Quote
  • Sep 30, 2019 3:51am Sep 30, 2019 3:51am
  •  silvertown
  • | Joined Oct 2016 | Status: Member | 8 Posts
when I combine this indicator with my strategy ;results are very promising...but for testing purpose I need push alert for color changing (mtf candles indi)..
  • Post #76
  • Quote
  • Sep 30, 2019 4:58am Sep 30, 2019 4:58am
  •  aaven
  • Joined Jul 2015 | Status: Member | 2,260 Posts
Quoting cfudge
Disliked
If you want the setfiles for the 3 daily charts go to posts 22 29 30 If you want the setfiles for the 3 4hr charts go to post 47 These are all for the xsupertrend indicator The frama ribbon set files are all the same as post 1
Ignored
Thank You Chris...
  • Post #77
  • Quote
  • Sep 30, 2019 5:25am Sep 30, 2019 5:25am
  •  aaven
  • Joined Jul 2015 | Status: Member | 2,260 Posts
Quoting cfudge
Disliked
If you want the setfiles for the 3 daily charts go to posts 22 29 30 If you want the setfiles for the 3 4hr charts go to post 47 These are all for the xsupertrend indicator The frama ribbon set files are all the same as post 1
Ignored
Chris,

Could you help me understand this:

For the 4HR charts, for the Frama Ribbon-"Time Frame To Use"-Do we use the Weekly Setting or do we use Daily Setting, because post#1 has settings for weekly and post#47 mentioned daily.

Thanks
  • Post #78
  • Quote
  • Sep 30, 2019 9:17am Sep 30, 2019 9:17am
  •  cfudge
  • Joined Apr 2013 | Status: Member | 1,158 Posts
Quoting aaven
Disliked
{quote} Chris, Could you help me understand this: For the 4HR charts, for the Frama Ribbon-"Time Frame To Use"-Do we use the Weekly Setting or do we use Daily Setting, because post#1 has settings for weekly and post#47 mentioned daily. Thanks
Ignored
Sorry guys...aaven is right, the Frama Ribbon is the same as post 1 set file but you need to have the TF 1 higher than the chart you place it on.
1
  • Post #79
  • Quote
  • Sep 30, 2019 9:29am Sep 30, 2019 9:29am
  •  cfudge
  • Joined Apr 2013 | Status: Member | 1,158 Posts
XAUUSD dot just presented itself.

The three red lines are the trades.

Chris
Attached Image (click to enlarge)
Click to Enlarge

Name: charts setup.jpg
Size: 240 KB
1
  • Post #80
  • Quote
  • Sep 30, 2019 9:58am Sep 30, 2019 9:58am
  •  DrDave
  • Joined Jun 2011 | Status: MEMBER: Temporary Suspension | 3,938 Posts
Quoting cfudge
Disliked
Here are the 6 charts setup for trading. 3 daily charts (on top) 3 4hour charts (on bottom) Two trades entered at opening. GL daily short AN 4hr long Already the dot on GJ has disappeared. I am going to trade this on every dot, so if at the close of the last daily/weekly candle we see a dot I will trade it. Let's see where we get. Chris {image} PS; The templates do not seem to work for me, not sure why??? If you +/- candle size the xSuperTrend does not show the candle colour properly, You have to turn "Auto adjust candle body" to false, close the...
Ignored
I am very interested in seeing how the GBPJPY sell turns out, because my bias is for longs. D1 is already overdue to go up.
The markets are speaking to you. Do you know their language?
IMT Pips This Year: 110
1
  • Trading Systems
  • /
  • Thanks Mladen & Mrtools (profitable system with 2 indicators)
  • Reply to Thread
    • 1 23Page 456 15
    • 1 3Page 45 15
0 traders viewing now
  • More
Top of Page
  • Facebook
  • Twitter
About FF
  • Mission
  • Products
  • User Guide
  • Media Kit
  • Blog
  • Contact
FF Products
  • Forums
  • Trades
  • Calendar
  • News
  • Market
  • Brokers
  • Trade Explorer
FF Website
  • Homepage
  • Search
  • Members
  • Report a Bug
Follow FF
  • Facebook
  • Twitter

FF Sister Sites:

  • Metals Mine
  • Energy EXCH
  • Crypto Craft

Forex Factory® is a brand of Fair Economy, Inc.

Terms of Service / ©2021