Disliked{quote} Do you mean you can't receive a signal from the indicator to use in the EA?Ignored
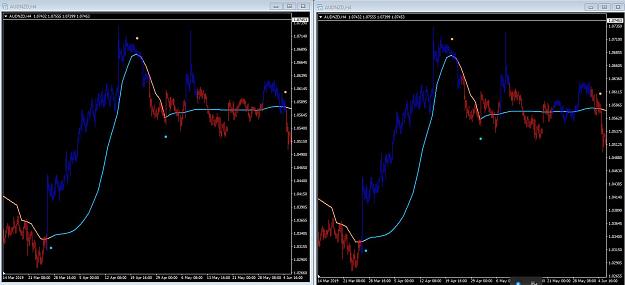
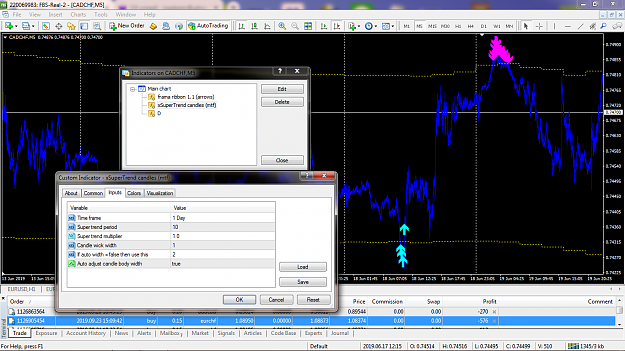
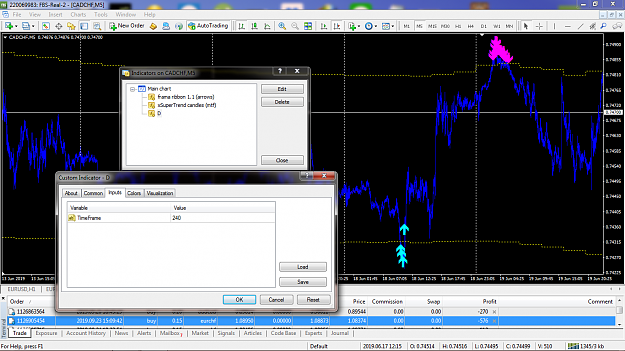
 Thanks Mladen & Mrtools (profitable system with 2 indicators)
- #54
- Sep 28, 2019 3:09pm Sep 28, 2019 3:09pm
- | Membership Revoked | Joined Jun 2011 | 9,885 Posts
To free Gazans of Hamas, use whatever it takes.
- #59
- Edited 8:57am Sep 29, 2019 6:33am | Edited 8:57am
- | Membership Revoked | Joined Jun 2011 | 9,885 Posts
To free Gazans of Hamas, use whatever it takes.
- #60
- Sep 29, 2019 6:45am Sep 29, 2019 6:45am
- | Membership Revoked | Joined Jun 2011 | 9,885 Posts
To free Gazans of Hamas, use whatever it takes.