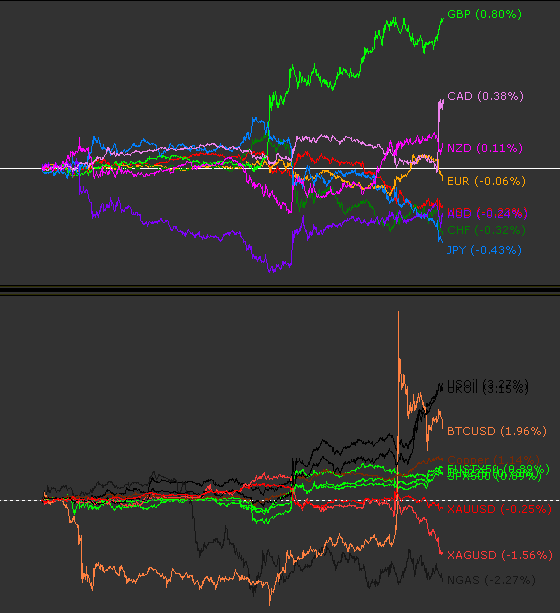
Disliked{quote} The Red and Green Lines are Volume and Price or Buyers and Sellers?Ignored
In short, there is a lot of factors and calculations behind it, but it aims to spot large differences between the two. This simple two lines graph just visually shows it. Then I've tested how to turn this information into my advantage. In order to believe in this you need to believe that the volume data from retails clients got a saying in how price moves.
1