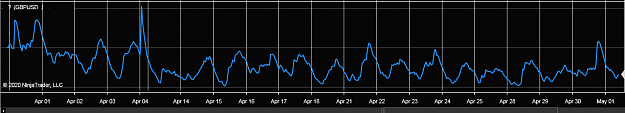
GBPUSD follow up
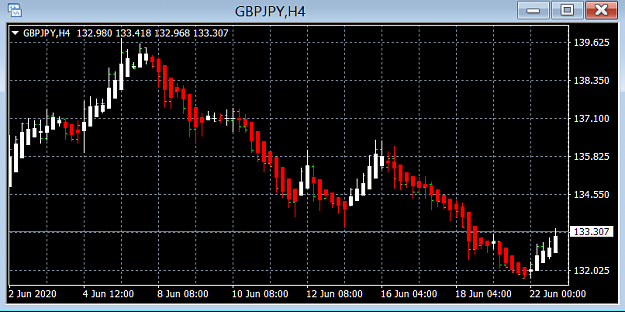
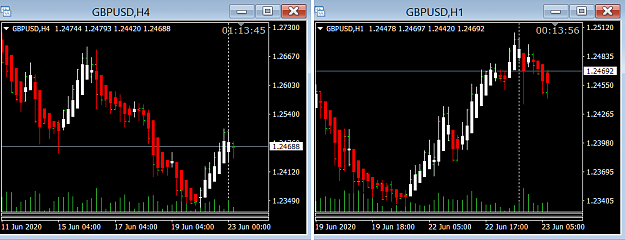
We saw yesterday M128 go down for a sell continuation. Shortly after, M256 also went down for an add on sell. This brought ALL charts from M4096 and lower down! Therefore, the cycling back up through the timeframes, beginning with M1, starts over.
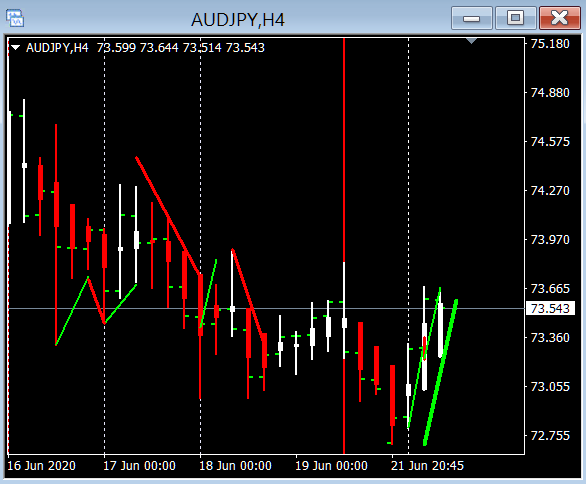
We see that already today, the up moves have made it through the M256 and threatening to take M512 up. However, this was blocked by smaller timeframes coming down which has progressed through taking M64 down and threatening M128. It is likely that there will be a turn up before M128 goes down.
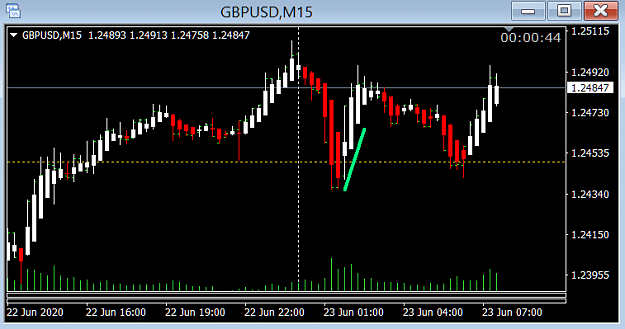
This last down move was robust with opportunities for sell continuation entries only appearing on very small timeframes.

We saw yesterday M128 go down for a sell continuation. Shortly after, M256 also went down for an add on sell. This brought ALL charts from M4096 and lower down! Therefore, the cycling back up through the timeframes, beginning with M1, starts over.
We see that already today, the up moves have made it through the M256 and threatening to take M512 up. However, this was blocked by smaller timeframes coming down which has progressed through taking M64 down and threatening M128. It is likely that there will be a turn up before M128 goes down.
This last down move was robust with opportunities for sell continuation entries only appearing on very small timeframes.
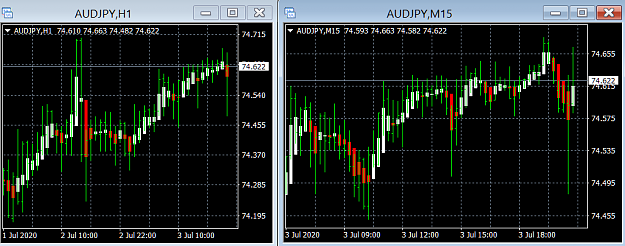
Attached Image (click to enlarge)
To free Gazans of Hamas, use whatever it takes.