Risk-on back on after clarity on Fed policy, trade. After a speech from Federal Reserve (Fed) chair Jerome Powell last Wednesday provided relief for investors that policy would not be as tight as feared in the coming year, global equities momentum is continuing after the U.S. agreed to postpone a planned increase in tariffs on $200 billion of Chinese goods as the two countries restart negotiations in earnest. The two sides are set to meet in Washington beginning in mid-December with a focus on the longstanding issues troubling American business leaders, including the forced transfer of technology, intellectual property protection, and cybersecurity. It is also expected that China will purchase more U.S. goods in agriculture, industrials, and technology. The goal is that the opening of these markets will help restore balance to global trade, while reducing the costs of cross-border commerce. While hard-liners may view the truce as a temporary delay tactic, we view any clarity relative to supply chain disruptions, input costs, and tariffs as supportive for further growth in trade and capital investment. It should also be noted that the 90-day timeframe, ending on or around March 1, would occur just before China’s annual national legislative session, normally a period where Chinese leaders are wary of making international concessions. Any escalation of the tariff war could be perceived as embarrassing for President Xi leading into this meeting. In our latest Weekly Market Commentary, due out later today, we share more of our thoughts on these major market-moving events and reiterate our positive stock market outlook.
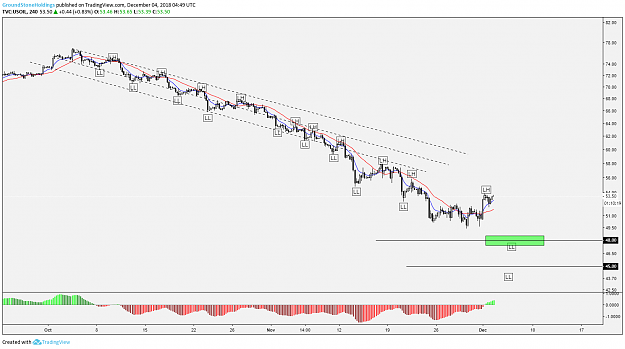
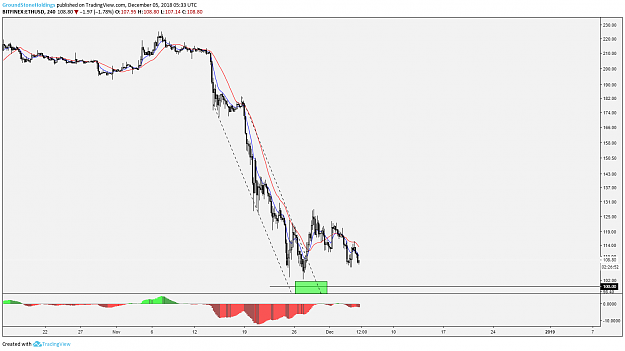
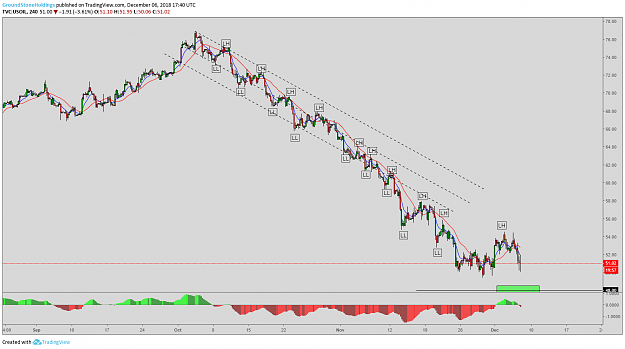
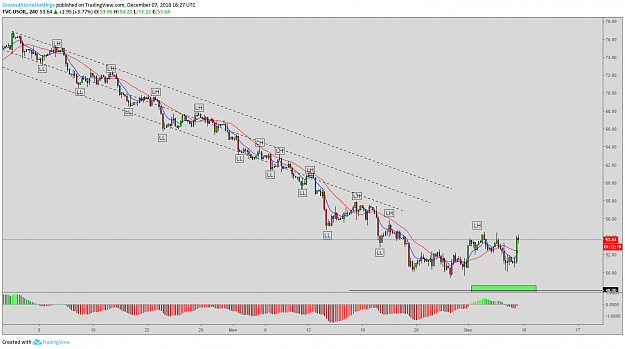
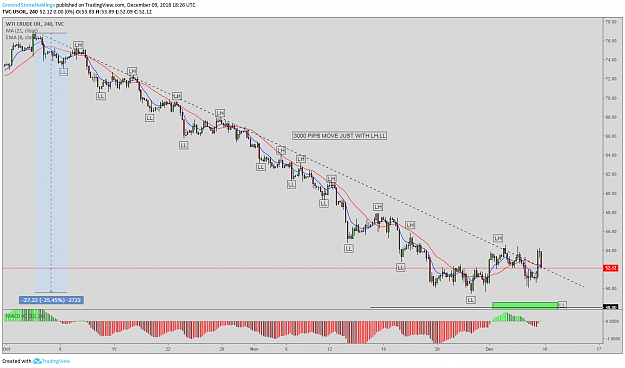
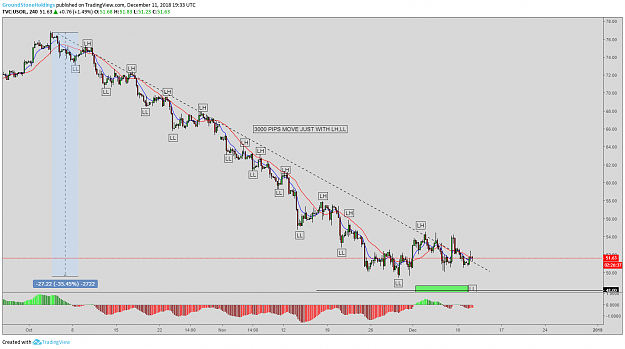
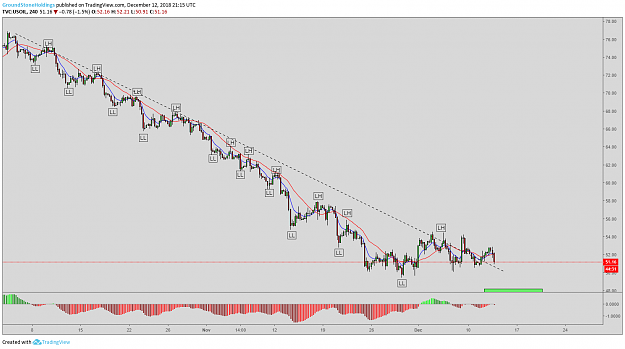
Oil catching a bid early. WTI crude is set to begin the week sharply higher on news that Russia and Saudi Arabia have announced an agreement to manage the oil market with the expanded members of OPEC, dubbed “OPEC+.” Though output cuts have not been confirmed by the group, the initial agreement opens the door to a production cut deal. Reports also suggested that the Canadian province of Alberta will cut oil production by almost 9%, or 325k barrels/day, to manage a pipeline bottleneck that has doubled the storage levels in the province. The U.S., though, is also producing record output, which contributed to oil’s ~22% plunge in November, and the influx of supply has put more pressure on OPEC + and non-OPEC producers to curtail output in the coming year. Consequently, we continue to believe that lower oil prices are primarily a supply-related issue and not indicative of global demand issues, and look for WTI to trade ~$65/barrel by the end of 2019.
Week ahead. Several Fed speeches will garner attention this week following last week’s dovish comments from chair Powell. Looking at economic releases, the monthly nonfarm payrolls report headlines the docket, but look for a bevy of Purchasing Managers Index data out of the U.S., Eurozone, and China to be among other important releases on investors’ radars.
Euro Higher on PMI Reports
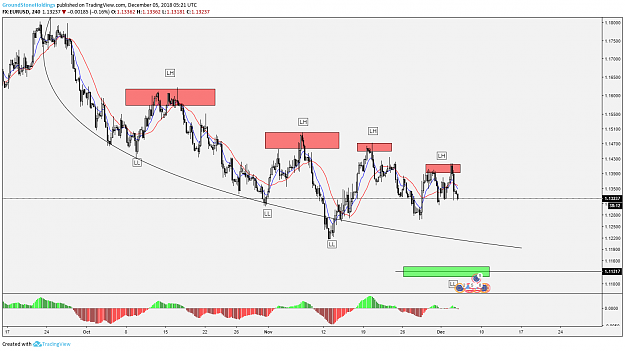
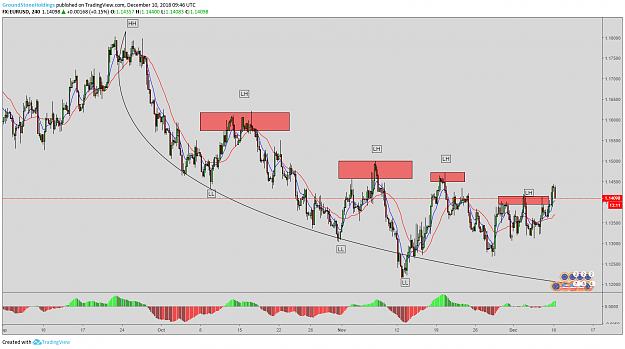
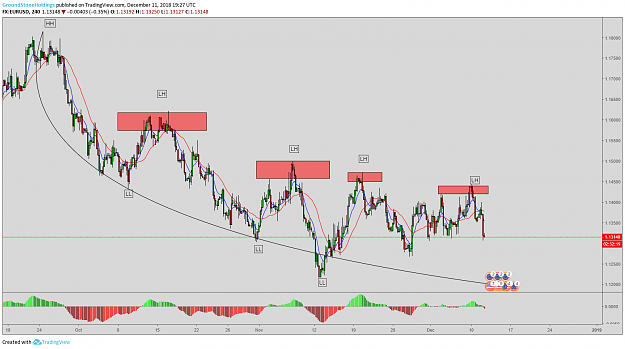
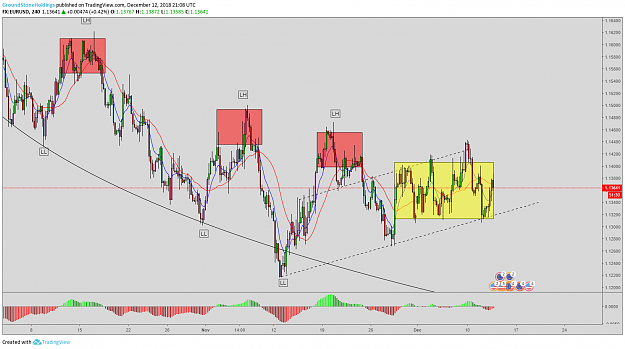
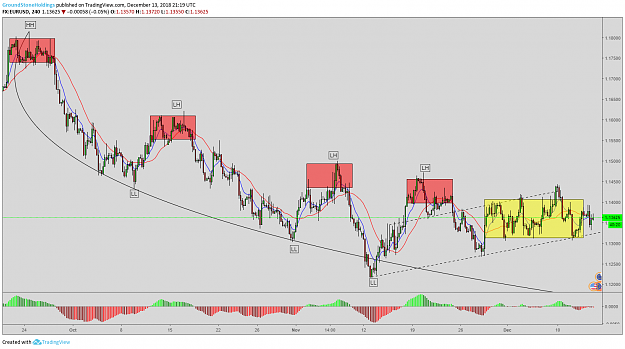
The Euro edged higher after the release of a slew of PMI reports which predominantly showed better than expected outcomes in November for the Euro area’s manufacturing sector. Led by Germany which had a Markit PMI reading of 51.8, above the 51.6 expected, Spain, France and the European Union as a whole all showed improvement in their manufacturing sectors last month. The only major EU nation to miss the mark was Italy, which had a reading of 48.6, below the 48.8 forecast and the 49.2 reading from the previous month. With a 50.0 threshold which separates an expanding economy from an contracting one, Italy is the only major sovereign in the Eurozone which has an economy that is in jeopardy.
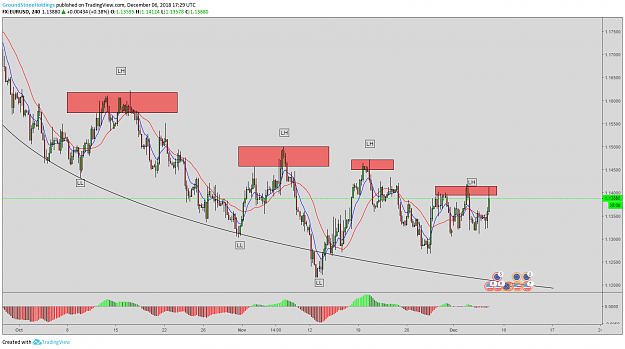
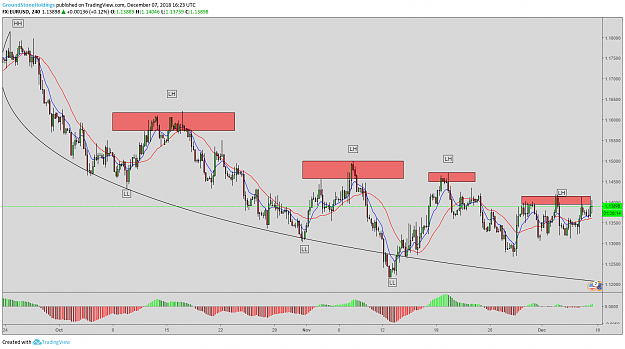
As reported at 10:39 am (GMT) in London, the EUR/USD was trading at $1.1345, up 0.24%; the pair has ranged from a trough of $1.13162 to $1.13798. The EUR/GBP was trading at 0.8906 Pence, up 0.32% and off the session peak of 0.89118 Pence.
Sentiment Improves for Higher Risk Currencies
In Argentina, after what some might consider a fruitful G20 summit, higher risk currencies like the Aussie and Kiwi Dollars edged higher in London trade on Monday. Both are rallying on the backs of the trade war cease-fire which was put forth by Presidents Trump and Xi. Analysts say that the de-escalation of trade rhetoric is certainly welcome news to FX market players and clearly helps to improve sentiment for currencies which are tied to the fate of the Chinese economy. The AUD/USD was trading at $0.7377, up 0.97%; the pair is moving off the session peak of $0.73935. The NZD/USD was trading higher at $0.6918, up 0.59%, and off the session high of $0.69306.
Short end of the yield curve inverts. The spread between 3- and 5-year, as well as 2- and 5-year Treasury yields turned negative yesterday for the first time since July 2007, though neither are reliable indicators of a pending recession. Instead, investors are effectively putting the Federal Reserve (Fed) on notice that its projected path of rate hikes between now and the end of next year is too aggressive. Fed fund futures currently suggest we’ll likely see two hikes next year at most, which aligns with our outlook, as global investors (and the Fed) start to appreciate the effects of the Fed’s balance sheet reduction, the impact of dollar strength, and the lack of threatening wage pressures.
Manufacturing activity remains robust. The Institute for Supply Management’s manufacturing index for November (59.3) came in ahead of consensus expectations for a 57.5 reading, up 1.6% m/m. New orders were up 4.7%, while the prices component was down 10.9% (showing increasing prices), with aluminum the most cited commodity up in price. Respondents flagged shortages, longer lead times, and tariffs as headwinds, though a healthy business environment and steady orders were positives. Final US Markit PMI Manufacturing for November (55.3) came in slightly below the 55.4 estimate, though new orders increased at fastest rate since May. Overall, manufacturing activity remains firmly in expansionary territory.
Rate hike expectations drop. Market expectations for rate hikes dropped significantly last month as strengthening economic headwinds weighed on investors. Daily Macro View
Oil prices extended their rally on Tuesday after a day of big gains on Monday as traders remained optimistic that OPEC will announce fresh production cuts after its meeting in Vienna later this week. On Monday both U.S WTI future and crude oil futures gained around 4 percent, with the rally prompted largely by the trade war ceasefire between the United States and China over the weekend, as well as expectations of a production cut. Prices for both benchmarks were both over 1 percent higher in the late afternoon in Hong Kong, with U.S. WTI futures up 1.02 percent as of 3:01 HK/SIN to trade at $52.46 per barrel. Brent was up 1.01 percent to trade at $62.31 per barrel.
In an effort to help OPEC keep prices from falling further the Canadian province of Alberta called for producers to cut output by 325,000 barrels per day until crude stockpiles are reduced. OPEC and Russia, its oil-producing ally, will need to further reduce production by 1.3 million barrels per day in order to balance out the current high inventories.
Dollar in Trouble
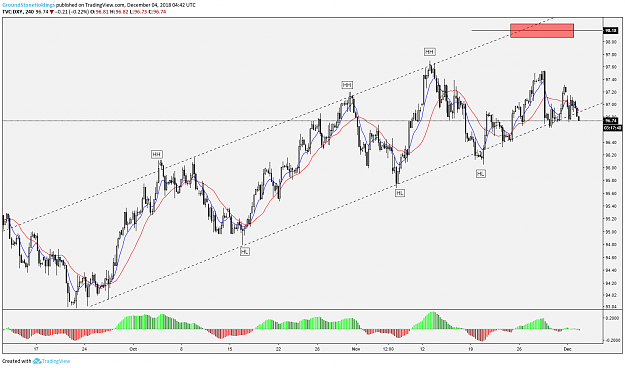
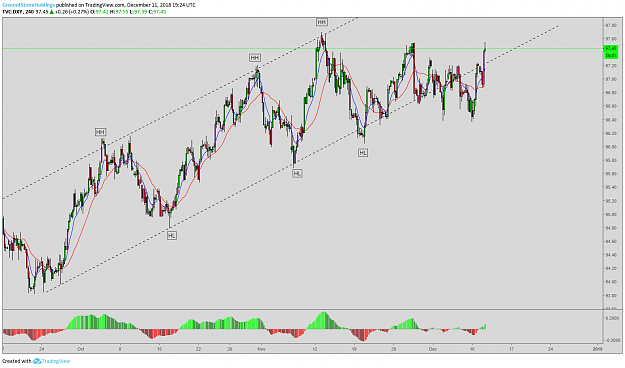
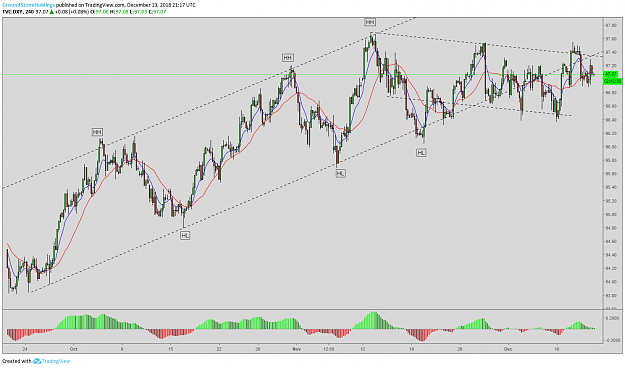
The dollar was lower on Tuesday after U.S. Treasury yields fell to three-month lows, a sign that the Federal Reserve might not raise interest rates as quickly as expected. The dollar index dropped 0.37 percent to 96.86 .DXY. Following the trade truce investors regained their interest in riskier currencies, a sentiment that did little to help the greenback. The dollar fell 0.52 percent against the yen to 113.06 and 0.14 percent against the Canadian dollar to $1.3176. It was also lower against the British pound and the euro.
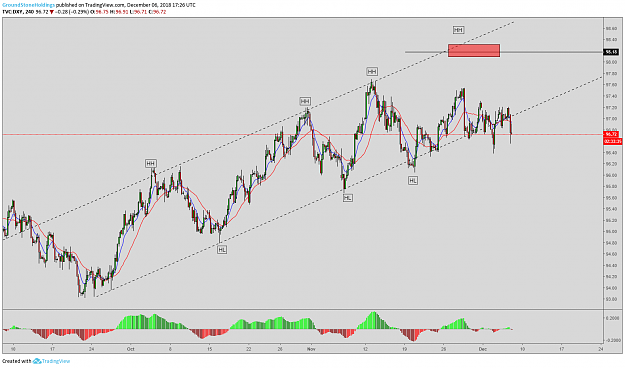
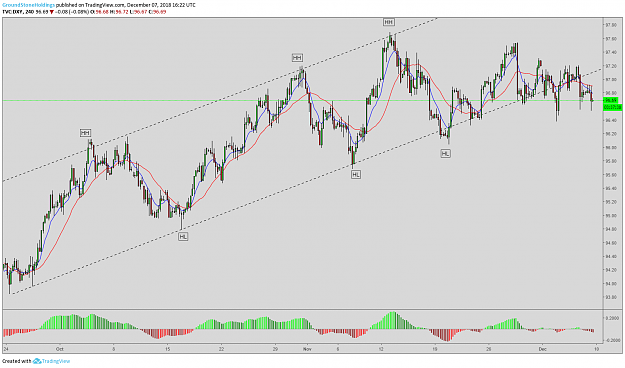
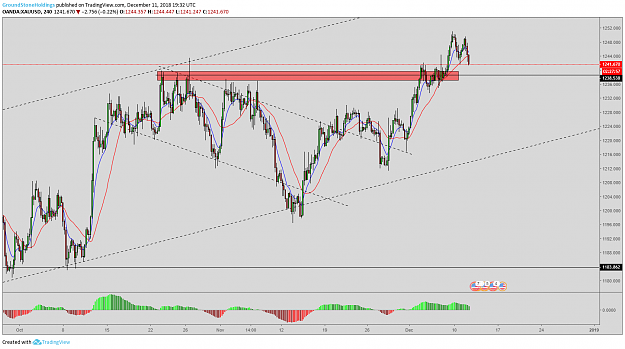
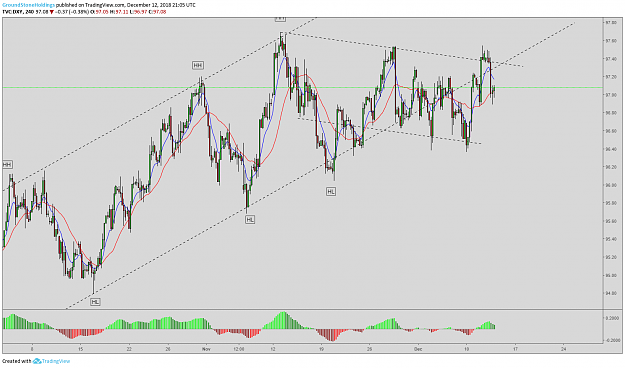
DXY:
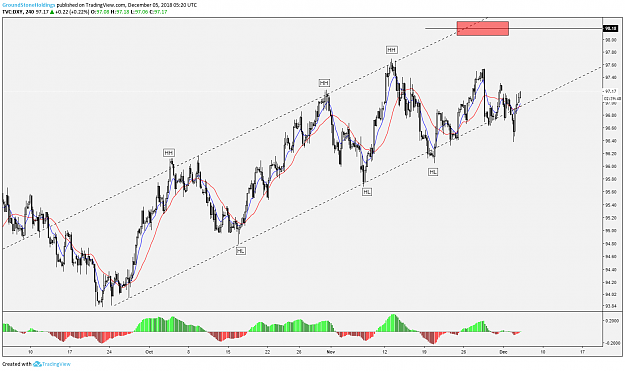
Intraday target: $97.50
Long-term target: $100
Tough day for stocks.
After their best week of the year last week, followed by healthy gains on Monday, major indexes did an about-face and fell more than 3% yesterday. Several catalysts drove traders to the sidelines (and into Treasuries): Inversion at the short end of the yield curve heightened recession fears and weighed on financials. In addition, the latest headlines from Washington, D.C. suggested President Trump’s successful characterization of what was agreed to with China may have been overstated. Additional details have been scarce and those that were available have conflicted, leading to doubts about whether 90 days is enough time to solidify meaningful terms. Profit taking likely also played a role after such strong gains last week.
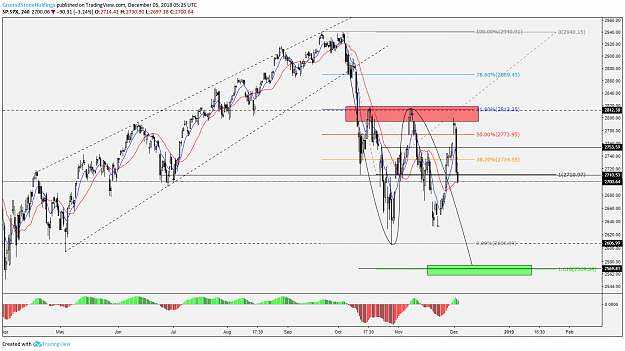
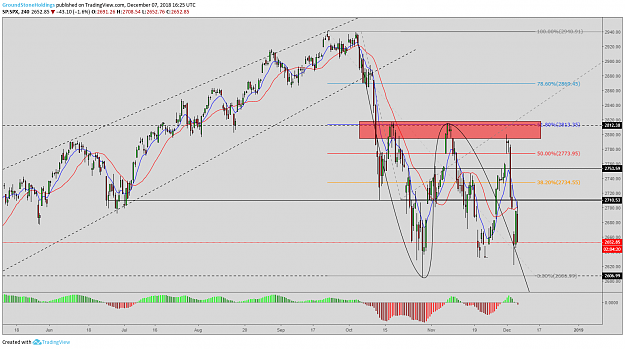
Keep in mind that volatility is normal. Though never pleasant, volatility is a sign of healthy, functioning markets. It’s hard to ignore the short-term swings, and we don’t want to be dismissive of the risks, but when focusing on market fundamentals, we continue to like stocks here and think our S&P 500 Index year-end fair value range of 2900-3000 is still reasonable. We encourage investors to remain focused on long-term goals.
Yield curve fears escalate.
With the short end of the Treasury yield curve inverting this week (2-5 year and 3-5 year) for the first time since 2007, many investors are wondering whether a recession could be forthcoming. However, it’s important to note that neither of these measures of yield curve steepness have been reliable precursors to recessions. We think this move may be better interpreted as a market signal to the Federal Reserve (Fed) that it needs to temper the pace of its rate hikes in 2019. As a recession indicator, the most reliable yield curve spreads have been those with larger maturity gaps, such as 2-10 year. Also, consider the yield spread between three month Treasury bills and 10-year notes remains above 50 basis points, implying the Fed may have room for at least two more hikes without potentially inverting the more predictive curve measures.
The latest polls on the Pound Sterling suggests that the fate of the currency is almost completely in the hands of the Prime Minister. According to the Reuters poll, sentiment revolves around Theresa May's ability to push her plans for the Brexit through the British Parliament. To a lesser extent, weak economic growth is also likely to weigh on sentiment, according to the 77 pollsters. The Prime Minister's fate relative to the Brexit will be called into question on December 11th when the Parliament votes on her withdrawal plan. The poll shows that approval of the plan could send the Pound higher by 3.5% while a defeat will likely result in a loss of about 2.75%.
As reported at 11:27 am (GMT) in London, the GBP/USD was trading at $1.2741, up 0.06%; the pair has ranged in a tight band from a low of $1.2700 to a high of $1.2753 in today's session. The EUR/GBP was trading at 0.89 Pence, down 0.9%; earlier, the pair had hit a low of 0.88923 Pence while the peak was recorded at 0.89278 Pence.
Japanese Yen Lifted as Trade War Fears Grow
The Japanese Yen, as a safe haven currency, is benefiting from renewed trade war fears. This was prompted by the news that the CFO of Chinese-based Huawei electronics was arrested in Canada at the behest of the United States. The shock waves over the implications of that arrest rippled global equity and FX markets. The USD/JPY was trading at 112.7570 Yen, down 0.3244%; the pair earlier hit a trough of 112.583 Yen. The EUR/JPY was trading at 127.8700 Yen, down 0.39%; the pair has ranged from 127.6740 Yen to 128.4300 Yen.
Stocks sliding again as bottoming process continues. After the 3-4% selloff Tuesday, the S&P 500 Index continues to slide in early trading. We view this morning’s action as progress toward a stock market bottom, and we could see enough fear today to set the stage for the next rally based on prior support levels, breadth, volume, put option activity, and other sentiment indicators suggesting a potential washout. While news that Chinese telecom provider Huawei violated economic sanctions against Iran isn’t helping, recent weakness has stemmed from three primary issues, all of which are tied to global growth concerns:
Trade: Initial news coming out of the G20 was positive. Despite mixed messages in recent days, progress toward a resolution has been made. Factoring all the headlines in, we continue to see a deal coming into view in early 2019.
Monetary policy: As expected, Federal Reserve (Fed) Chair Powell’s speech in New York last week delivered on our expectation that the Fed would not be as aggressive in 2019 as many market participants feared. On the yield curve, the more predictive inversions (2s, 10s and T-bills/10s) have not occurred, and even when they potentially do, stocks can continue to go higher based on history. Keep in mind that year-end supply issues may be distorting the short end of the curve.
Oil: OPEC is meeting in Vienna today and hopes for a coordinated production cut to lessen the downward pressure on oil prices remain high. Our projection was for a reduction in output of about ~1.3m barrels per day (bpd), but as of this writing (8:30 AM ET) it was unclear to what degree OPEC output would be reduced. Saudi officials threw out a smaller cut of 1m bpd. We believe supply is a much bigger issue for oil than demand, so we would not view $50 crude as an indication of increased probability of a recession in the United States.
ADP employment data misses, but labor market remains healthy. Today’s ADP employment report showed U.S. firms added 179k jobs in November, below consensus estimates of 195k, and signals that job growth in tomorrow’s November nonfarm payrolls report could fall short of the forecasted 190k increase. Meanwhile, a separate report showed initial claims for unemployment benefits fell to 231k last week but has trended higher over the past few weeks. While lower-than-expected payrolls growth and an uptick in claims may sound worrisome, investors place more emphasis on the nonfarm payroll data, and job creation levels >150k amid a very tight labor at this point in the cycle remains encouraging.
Global manufacturing divergence widens. The latest batch of global manufacturing surveys for November indicate the U.S. has strengthened its lead in terms of manufacturing health. The U.S. measures are highest (mid-to-high 50s) and held firm or accelerated last month-depending on the source-while China’s measures are at 50, the breakeven between expansion and contraction, and Europe’s measure, at 51.8, has fallen to near two-year lows. Overseas economies may benefit from fresh stimulus at some point and/or potential trade deals, but for now the U.S. economy remains the standout performer globally and remains our preference to focus asset allocations.
EM resilience. Since the September 20 peak in the S&P 500, as of December 4, the MSCI Emerging Markets (EM) Index has lost just 1.9%, much better than the 7.5% loss in the S&P 500 during that period. The developed international equity benchmark MSCI EAFE Index has fared slightly worse than the S&P 500 with a 7.8% decline. Despite this week’s confusion around what China has agreed to in trade negotiations, we view recent EM outperformance as a reflection of the market’s optimism that a deal will come into view before too long. Daily Macro View
The US Dollar was finally seeing some recovery after struggling for traction earlier in the Asian trading session. That comes on the back of growing speculation that the Federal Reserve Bank is not likely to continue to project a hawkish outlook into 2019. Analysts and market players both believe that the Fed will pause its tightening cycle not long after they give the green light on the expected December rate hike at their next policy meeting. What is worrying markets is the steep declines in yields for US Treasury instruments, suggesting the strong likelihood that the US economy could soon be heading for a significant downturn.
As reported at 10:30 am (JST) in Tokyo, the USD/JPY was trading flat at 112.7170 Japanese Yen. Remaining in Asia, the AUD/USD was trading lower at $0.722, down 0.16% while the NZD/USD was trading at $0.6878, down 0.03%.
Markets to Focus on NFP Data
In the hours ahead, markets will focus on the release of the November Non-Farms Labor Report from the United States Labor Department. The latest poll shows that analysts believe new private sector jobs will have fallen to 200,000, down from 250,000 in October. The unemployment rate is predicted to remain unchanged at 3.7%; analysts also have predicted that the average hourly earnings will be flat at 3.1%. The Federal Reserve has a mandate to ensure full employment while maintaining price stability, so any data which impacts one or the other of their criteria is deemed a market moving event.
DXY:
Intraday target: $96.80
Long-term target: $100
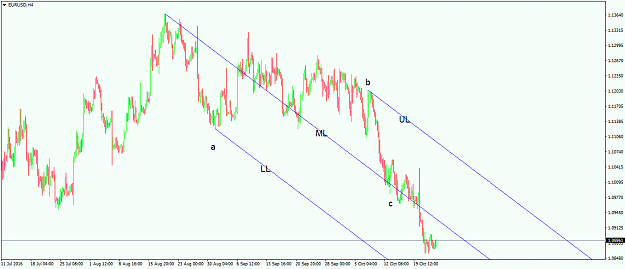
Andrew’s Pitchfork comes from the name of one Dr Andrew, who used a pitchfork to forecast future prices, and developed a trading system many find very interesting. The system became so popular over time that the Andrew’s Pitchfork trading tool has been integrated into all trading platforms. The idea behind trading with Andrew’s Pitchfork is to find three points, called pivots; and from those three pivots, the pitchfork should be drawn. Any pitchfork has three lines, and each line starts from the three pivots mentioned above. The lines are called the upper line (UL), the lower line (LL) and the median line (ML). Out of these three lines, the most important one is the ML, the reason being that it has an important characteristic: It attracts price. There are many ways to use the Andrew’s Pitchfork, and this is because it is a matter of controversy as to how to set the three pivot points. This is the most important decision when trading with a pitchfork, as different pivot points will result in different angles for the overall pitchfork, which will then lead to different results when interpreting the market.
TRADING WITH THE PITCHFORK
To overcome this inconvenience, traders use the Andrew’s Pitchfork tool in conjunction with the Elliott Waves theory. The reason for this is that the Elliott Waves theory allows for knowing exactly where a specific wave ends, and these endings are the places for the pivots to be set on the pitchfork.
USING THE PITCHFORK IN CONJUNCTION WITH ELLIOTT WAVES THEORY
Because the Elliott Waves theory is based on both impulsive and corrective waves, there are two separate ways to use the pitchfork, both of which reflect the same thing: the fact that the price was attracted by the ML. A pitchfork comes in handy for finding the ends of specific waves under the Elliott Waves theory as well. This is very important for traders who count waves, as if the extension in an impulsive wave is respected, by the time the ML is reached, most likely the third wave in an impulsive move is completed as well.
Pitchfork with Impulsive Waves
The way to use the pitchfork tool with impulsive waves is to try to find the end of the third wave, as this is the most likely wave to extend. The three pivot points should therefore be placed as follows:
The first pivot should be placed at the start of the impulsive wave. This would be the equivalent of the first click on the screen after selecting the Andrew’s Pitchfork tool.
The second one should be the end of the first wave.
The last one should be the end of the third wave.
The resulting pitchfork will resemble a rising channel in a bullish impulsive move, or a falling one in a bearish move. The distance between the ML and the other two lines in the pitchfork is always the same, as the ML stays at 50% distance. It means that the channel is basically split into two equal parts. In an impulsive wave, no matter whether a bullish or a bearish one, it is very difficult for the price to go much further than the ML. This is because in a bullish pitchfork, the price will rarely reach the UL, but will settle for the ML. By the time the ML is reached, look for the third wave in the impulsive wave to be completed, providing the extension rules are respected.
Pitchfork with Corrective Waves
The same thing is valid when it comes to corrective waves under the Elliott Waves theory, with the difference that the three pivot points that make up the Andrew’s Pitchfork are placed as follows:
The first one at the start of the correction;
The second one at the end of the a-wave;
The third one at the end of the b-wave.
Attached Image (click to enlarge)
If, in the case of an impulsive move, the aim was to have an idea about the end of the possible third wave by the time it reached the ML, in this case the ML is used to find out the end of the c-wave. The c-wave can be the c-wave of a flat, a zigzag, or even a triangle. The idea is that its interpretation with the pitchfork is the same and, believe it or not, is very accurate, providing the Elliott Waves counting was correct.
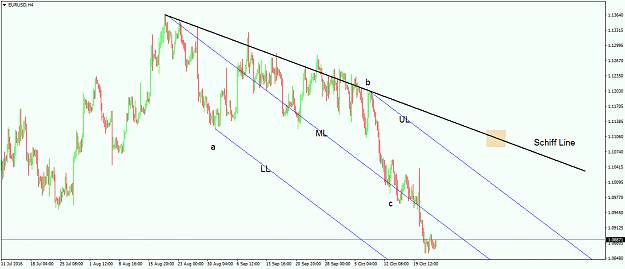
USING ANDREW’S PITCHFORK TO SPOT REVERSALS
This way of using the pitchfork is the living proof that a trend has ended. Traders are now using a new line in conjunction with the three lines of the original pitchfork. Obtaining such a line is simple and straightforward, in the sense that all one needs to do is to connect the start of the pitchfork (or the first pivot) with the end of the pitchfork (or the last pivot). The resulting line is called the Schiff line, and it represents the bull/bear line that defines a trend. As a rule of thumb, the Schiff line should not be broken if the trend is still in place. If the Schiff line is broken by future price action, this will invalidate the pitchfork, which means that the trend described by the pitchfork is completed, and a new one started. If a new trend has started, then the previous pitchfork needs to be deleted, together with its Schiff line, and a new one for the new trend should be drawn. The big advantage when using the Schiff line is that the reversal is visible, and it is not possible to be caught on the wrong side of the market. The breaking of the Schiff line is lagging, and the market will most of the time move violently to break it. However, this doesn’t change the fact that traders are warned that the previous trend is over, and that they should reconsider the analysis. Such a break will have bearish implications in a bullish trend, and bullish implications in a bearish one.
Attached Image (click to enlarge)
There are other ways to use the Pitchfork. Some trading platforms use Fibonacci ratios to draw parallel lines with the ML and the UL and LL. These parallel lines are drawn at 61.8%, 161.8% or other Fibonacci ratios to find out future dynamic support and resistance levels.
Stocks sliding again as bottoming process continues. After the 3-4% selloff Tuesday, the S&P 500 Index continues to slide in early trading. We view this morning’s action as progress toward a stock market bottom, and we could see enough fear today to set the stage for the next rally based on prior support levels, breadth, volume, put option activity, and other sentiment indicators suggesting a potential washout. While news that Chinese telecom provider Huawei violated economic sanctions against Iran isn’t helping, recent weakness has stemmed from three primary issues, all of which are tied to global growth concerns:
Trade: Initial news coming out of the G20 was positive. Despite mixed messages in recent days, progress toward a resolution has been made. Factoring all the headlines in, we continue to see a deal coming into view in early 2019.
Monetary policy: As expected, Federal Reserve (Fed) Chair Powell’s speech in New York last week delivered on our expectation that the Fed would not be as aggressive in 2019 as many market participants feared. On the yield curve, the more predictive inversions (2s, 10s and T-bills/10s) have not occurred, and even when they potentially do, stocks can continue to go higher based on history. Keep in mind that year-end supply issues may be distorting the short end of the curve.
Oil: OPEC is meeting in Vienna today and hopes for a coordinated production cut to lessen the downward pressure on oil prices remain high. Our projection was for a reduction in output of about ~1.3m barrels per day (bpd), but as of this writing (8:30 AM ET) it was unclear to what degree OPEC output would be reduced. Saudi officials threw out a smaller cut of 1m bpd. We believe supply is a much bigger issue for oil than demand, so we would not view $50 crude as an indication of increased probability of a recession in the United States.
ADP employment data misses, but labor market remains healthy. Today’s ADP employment report showed U.S. firms added 179k jobs in November, below consensus estimates of 195k, and signals that job growth in tomorrow’s November nonfarm payrolls report could fall short of the forecasted 190k increase. Meanwhile, a separate report showed initial claims for unemployment benefits fell to 231k last week but has trended higher over the past few weeks. While lower-than-expected payrolls growth and an uptick in claims may sound worrisome, investors place more emphasis on the nonfarm payroll data, and job creation levels >150k amid a very tight labor at this point in the cycle remains encouraging. Global manufacturing divergence widens. The latest batch of global manufacturing surveys for November indicate the U.S. has strengthened its lead in terms of manufacturing health. The U.S. measures are highest (mid-to-high 50s) and held firm or accelerated last month-depending on the source-while China’s measures are at 50, the breakeven between expansion and contraction, and Europe’s measure, at 51.8, has fallen to near two-year lows. Overseas economies may benefit from fresh stimulus at some point and/or potential trade deals, but for now the U.S. economy remains the standout performer globally and remains our preference to focus asset allocations. EM resilience. Since the September 20 peak in the S&P 500, as of December 4, the MSCI Emerging Markets (EM) Index has lost just 1.9%, much better than the 7.5% loss in the S&P 500 during that period. The developed international equity benchmark MSCI EAFE Index has fared slightly worse than the S&P 500 with a 7.8% decline. Despite this week’s confusion around what China has agreed to in trade negotiations, we view recent EM outperformance as a reflection of the market’s optimism that a deal will come into view before too long.
A meeting between OPEC members and their oil-producing allies on Friday resulted in an agreement to cut oil supply by 1.2 million barrels per day starting in January. The production cuts will include an 800,000 barrel per day cut by OPEC countries and a 400,000 barrel per day cut by non-OPEC oil producers. Oil prices spiked on Friday after news of the agreement. Brent prices were also supported on Monday by the shutdown of Libya’s El Sharara oilfield, though U.S. WTI futures were trading lower.
U.S. WTI futures were trading at $52.38 per barrel as of 3:15 p.m. HK/SIN on Monday, down 0.44 percent. Brent crude futures were up 0.28 percent to $61.84 per barrel. Despite the cuts, not all traders expected prices to be supported as OPEC expects, due to increased production in the United States and President Donald Trump’s public acknowledgment that he prefers prices to be as low as possible. A downward global economic outlook may also reduce demand which would push prices lower. On Monday, Japan, the world’s third-largest economy and fourth-biggest oil consumer, reduced its third-quarter GDP growth down from initial forecasts. The recent global stock plunge also has traders concerned about global economic growth in the coming year.
Stocks Continue Downward Spiral
Global stock markets tanked on Friday, with Wall Street’s benchmark indexes closing no less than 2 percent lower. The Nasdaq lead the losses, plunging 3.05 percent on the day. The S&P 500 and the Dow Jones Industrial Average slumped 2.33 percent and 2.24 percent respectively. The losses extended into Monday’s Asian trading session, with markets trading in a bloody sea of red. Australia’s ASX 200 was down 2.27 percent and Japan’s Nikkei 225 trailed closely behind, easing 2.12 percent. Hong Kong’s Hang Seng Index was down 1.32 percent while the Shenzhen Composite was 1.39 percent lower. The Shanghai Composite was 0.82 percent lower.
The losses were prompted by growing fears that rising tensions between Washington and Beijing could sabotage chances for a trade deal within the current 90day deadline. Weaker than expected data out in recent days from Japan, China and the United States also sent traders running away from the markets with no sign of if or when they’ll be returning.
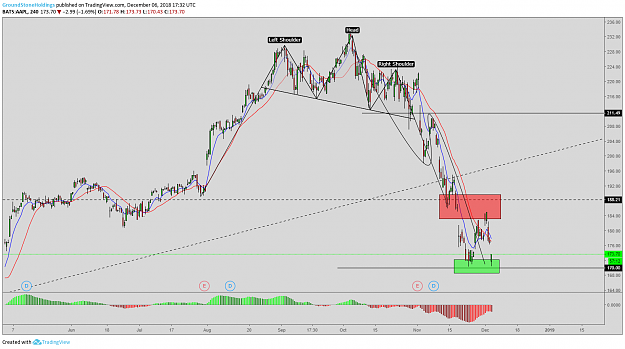
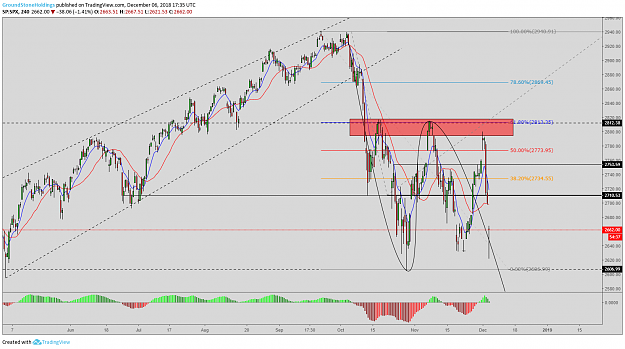
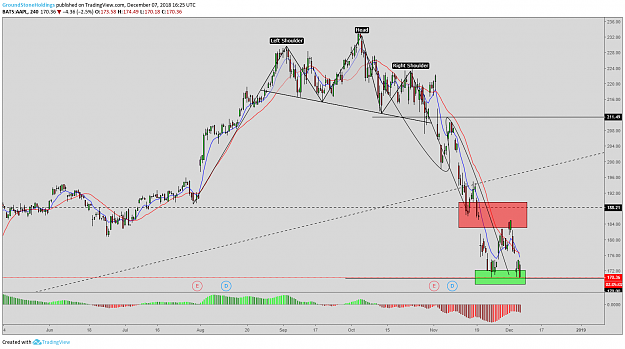
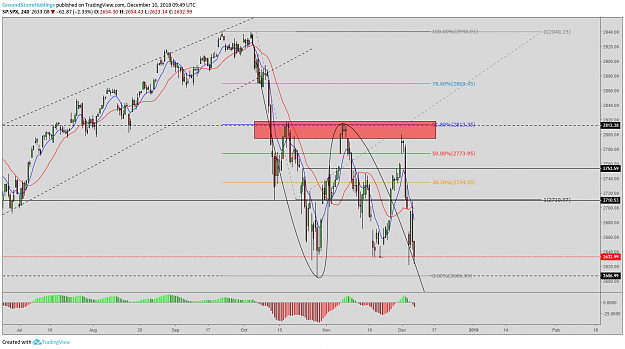
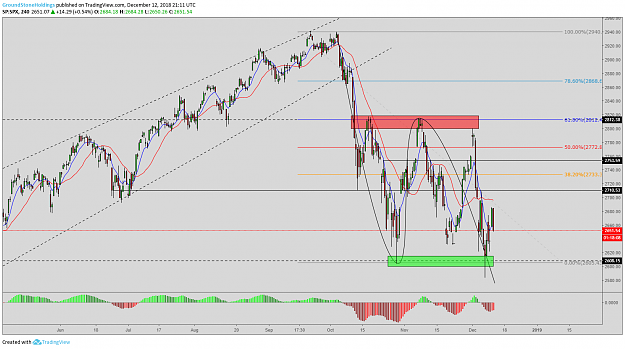
Retesting October-November lows. The S&P 500 Index fell 4.6% last week, its worst week since March, leaving the index in line with the lows of the latest correction. Losses were driven primarily by three issues: the risk that U.S.-China trade talks fall apart (see below), concerns about a Fed policy mistake, and sharply lower oil prices (see below), all of which contributed to increasing concerns about slowing global growth or recession. In today’s Weekly Market Commentary, we summarize our views on these issues and discuss prospects for a stock market rebound based on technical analysis.
We continue to see the U.S-China trade dispute as the biggest headwind for stocks. Against that backdrop, it is understandable that stocks threw a tantrum last week after U.S. trade officials walked back part of the apparently overly-optimistic recount of the Trump-Xi meeting at the G-20 summit. While no resolution has been reached, we continue to view the emergence of a path toward progress favorably and expect an agreement in the coming months, despite mixed messages from both sides and the arrest of a Chinese telecom executive. In this week’s Weekly Economic Commentary, due out later today, we provide some insight regarding the outcome of the G-20 meeting and what we expect over the next ~90 days as the two sides re-instate negotiations.
Leading indicators still pointing positive. Risk of a full-blown trade war with China and some potentially concerning market signals have increased fears of recession. One such signal is the inversion of the short end of the yield curve, including the spread between 2- and -5 year Treasuries. But the yield curves that have historically been more predictive of future recessions (2-year and 10-year, and 3-month and 10-year Treasuries) have not inverted. And even when they potentially do, stocks can continue to go higher for a year or two based on history. When we look at signals from the bond market alongside our other favorite leading indicators, we still see low odds of recession in the coming year.
Oil has a supply problem. Sharply lower WTI crude oil prices are also being cited by some as a sign of looming recession. But oil’s weakness has been driven mostly by supply issues, including Iran sanctions, record levels of U.S. production, and elevated domestic inventories. We think OPEC’s decision to cut 1.2 million barrels of production last week is a positive step and will help stabilize prices.
Brexit vote put on ice. In a last minute decision, British Prime Minister Theresa May decided to postpone tomorrow’s Brexit vote. Over the weekend, May insisted the vote would take place despite expectations that it would fall short by a large margin. We’re not convinced the vote will ever happen, but headline volatility is likely to persist as the UK approaches the March 29, 2019 deadline for leaving the European Union.
Plagued by concerns about the upcoming Brexit, the British pound has sunk to levels not hit since April 2017. The currency was flogged most recently by yesterday’s announcement that the British government will postpone a Brexit vote in Parliament that was originally scheduled for today. On Monday the pound slumped 1.7 percent against the dollar. It also traded down against the euro. On Tuesday, the sterling recouped some of its losses, gaining modestly against its two primary trading partners. The sterling was up 0.14 percent against the greenback as of 1:18 p.m. HK/SIN, to $1.2575. It was trading at 0.9037 against the euro. The pound is down over 7 percent since the beginning of 2018.
According to British Prime Minister Theresa May, the decision to delay the parliamentary vote was based on her concern that the Northern Irish would cause her proposal to lose, despite widespread support from other leaders. Despite May’s optimism, her critics have claimed that the deal is a sellout for the United Kingdom and that it will reduce the region’s influence while clinging to many of the EU rules May was trying to extricate the UK from.
Stock Markets Seek Direction
Asian markets were mixed on Tuesday after a volatile trading day on Wall Street saw the three benchmark indexes eke out modest gains. Chinese shares were trading in positive territory after Beijing announced that it was still involved in trade talks with the United States. The Shenzhen Composite was up 0.48 percent and the Shanghai Composite was up 0.28 percent. Hong Kong’s Hang Seng Index gained 0.04 percent, while Australia’s ASX 200 gained 0.29 percent. Japan’s Nikkei 225 eased 0.41 percent in the early afternoon. Analysts expect increased volatility in the coming days as traders wait to hear about the latest round of U.S.-Sino trade negotiations.
DXY:
Intraday target: $97.70
Long-term target: $100
Daily Insights Another big reversal off the lows. The S&P 500 Index once again found support near the bottom end of its recent range, this time bouncing significantly off the intraday lows. At its low’s, the S&P 500 was down 1.9%, but managed to finish in the green. You have to go back to February 6th the last time that happened. This comes on the heels of last Thursday, when the S&P 500 bounced nearly 3% off of the intraday lows – the largest intraday reversal since February 9. Don’t forget, February 9 was also the intraday low for 2018. Bottoms are a process and we are encouraged by these reversals off of support.
Bonds have done their job. Over the past month while the S&P 500 Index has lost 5% on a total return basis, Treasuries have gained 2% based on the broad Bloomberg Barclays Treasuries Index. Does that mean sell stocks and buy Treasuries? We don’t think so. However, this latest performance does underscore the value of moving up in quality with fixed income allocations at this stage of the business cycle as we have suggested for suitable investors.*
Despite the latest rally, we still see long rates going higher.We would not chase Treasuries here even though we believe shoring up quality of fixed income portfolios makes sense at this point. Given our expectations for economic growth, inflation and Federal Reserve (Fed) policy going forward, we think rates go higher from here. We continue to see 3.25% at a reasonable near term target to the upside, with potentially an additional 0.25% to 0.5% of upside in 2019. From a technical analysis perspective, we believe the odds favor the 2.80% support level on the 10-year Treasury yield holding in the near term.
Renewed trade talks off to promising start. Following a phone call between U.S. and Chinese officials to kick off the latest round of trade negotiations, President Trump announced that Beijing has “agreed to reduce and remove tariffs on cars coming into China from the U.S. Currently the tariff is 40%.” Also reportedly discussed on the call were China’s purchases of agricultural products, as well as changes to fundamental Chinese economic policies. Further details were not made available, but the developments are an excellent sign of progress.
U.K. PM making the rounds (again) after canceling Brexit vote. British Prime Minister Theresa May is traveling around Europe today as she meets with key officials in search of tweaks to the deal for which yesterday’s vote was postponed. However, European Commission president Jean-Claude Junker indicated the European Union is willing to give the U.K. further clarifications on Brexit but will not renegotiate the treaty. A “no-deal” result, where the U.K. still leaves the European Union but without terms in place, is an outcome that would be very messy and desired by almost no one; however, the odds are increasing.
Small business optimism dips as producer prices rise. Data out this morning showed that the NFIB Small Business Indexdeclined month over month (MoM) but remains elevated. A tight labor market was among the top reasons for tempered optimism that helped push the percentage of employers planning to raise wages to near 30-year highs. Employers’ expectations to increase compensation comes as the Producer Price Index (PPI) ticked up 0.1% MoM in November but was down sharply from October’s 0.6% increase thanks to falling gas prices. Excluding food and energy, the core PPI was up 0.3% MoM, and 2.7% YoY, declining from the prior month and providing some additional support for the market’s signals that the Federal Reserve should slow its pace of hikes.
The Pound Sterling recovered from the overnight 20-month trough despite continued threats to the Prime Minister's position by members within her own party. Theresa May has said that she would fight any challenge, though there are now enough votes to force a no-confidence vote against her; that vote is scheduled for later today. Analysts say that they are not positive the challenge will succeed, as it will mean those who voted against her would be blamed for the hard Brexit outcome. Moreover, they say that a failure to oust her would mean that Ms. May would likely intentionally isolate the party members who voted against her.
As reported at 11:38 am (GMT) in London, the GBP/USD was trading at $1.2525, up 0.32% and off the session low of $1.2478. The EUR/GBP was trading at 0.9046 Pence, down 0.19%; the pair has ranged from a trough of 0.90250 Pence to a high of 0.90690 Pence in today's trading session.
Pound Traders Wary Ahead of Vote
Analysts are divided about the outcome of today's vote; some believe Ms. May to be safe because it took such a long time for her party to find the votes needed to trigger the call for the no-confidence vote. Moreover, they believe that those party members who do vote against her have too much at stake to lose if they can't ensure a win. Other analysts feel the vote there is a greater likelihood that she will be ousted. Regardless, analysts are in agreement that market players are in for a roller-coaster ride afterward, with volatility especially high if she is defeated or only narrowly escapes defeat.
May to face confidence vote on Brexit. UK Prime Minister Theresa May will face a vote of confidence after the required 48 letters of “no confidence” were received from MPs following her three-stop tour across Europe yesterday. The meetings were an attempt to seek changes to her existing deal after she was forced to abandon a planned Parliamentary vote due to a lack of support. She could be replaced as early as mid-January if a simple majority of 158 Conservative MPs vote in favor. With the March 29 deadline looming for the UK to break from the EU, with or without a Brexitdeal, along with Italy’s ongoing budget scuffle with EU officials and broader European economic data trending in the wrong direction, we continue to suggest avoiding or minimizing tactical exposure to the region.
Is a shutdown coming? President Trump threatened to shut down the U.S. government next week in a discussion with Senate Minority Leaders Chuck Schumer and House Minority Leader Nancy Pelosi yesterday. So what does it mean for stocks if this happens? The good news is the S&P 500 Index has gained during each of the previous five shutdowns going back 23 years. We will take a closer look at this potential event later today on the LPL Research blog, but it’s worth noting that another, more important, debt ceiling debate will take place next summer. Oil slide keeps inflation in check. Consumer Price Index data out this morning showed prices declined month over month, thanks to oil’s continued decline in November, which offset increases in an array of other areas including: shelter, used cars/trucks, medical care, and recreation. Meanwhile, the core reading (ex food and energy) was unchanged from the prior month but increased 2.5% year over year. Though not the Federal Reserve’s preferred inflation measure, it should keep it on track to raise rates at next week’s monetary policy meeting.
Pound Higher on May Relief
The Pound Sterling edged higher during Thursday trade in London after the Prime Minister managed to eke out a win after the Parliamentary no-confidence vote on Wednesday. Analysts say that despite the relief over Ms. May's success, this time, that the Pound is still unlikely to see too much in the way of gains given the fact that the Parliament is still uncertain of the way forward for the Brexit. Theresa May is planning to seek the assistance of her European counterparts, likely asking for more concessions to make the Parliamentary proposal more palatable to her party.
As reported at 11:24 am (GMT) in London, the GBP/USD was trading at $1.2657, up 0.21% and moving away from the session peak of $1.2687; the low was recorded at $1.2610. The EUR/GBP was trading at 0.8993 Pence, down 0.05%; the pair has ranged from a low of 0.89729 Pence to a peak of 0.90147 Pence.
ECB in Focus
While the Pound has taken the market's attention in recent days, markets will focus on today's decision by the European Central Bank. For the most part, analysts expect the bank to reign in the quantitative easing efforts, but what is really the question is their outlook for rate hikes moving into 2019. Analysts believe that, given the economic situation in the Eurozone, and especially in Italy, Mario Draghi, the current head of the ECB, is likely to express caution for a rate increase in the near term. Currently, the EUR/USD is trading at $1.1379, up 0.07%.
Trade tensions cooling. China has resumed soybean purchases for the first time since tariffs were put in place, and more corn shipments could be next according to a Bloomberg report overnight. China also indicated it would provide greater market access to foreign companies, consistent with the Trump administration’s goal to level the playing field. These developments follow reports earlier in the week that China would lower tariffs on imported autos, contributing to cooling tensions and increased optimism the two sides can find middle ground and reach a deal even as the conflict over the arrested Huawei executive escalates.
May survives but Brexit uncertainty remains. Theresa May won a no confidence vote, though by a narrow enough margin that her ability to push through her Brexit plan remains very much in doubt. Still, the result increases the odds of a market-friendly outcome: either an orderly exit or no exit at all, as opposed to a disorderly exit (so-called “hard Brexit”). Economic risk to the U.K. is high, but as the March 2019 deadline approaches, a deal becomes increasingly likely.
ECB threads the needle? Weaker growth in Europe was not enough to scare the European Central Bank (ECB), which announced this morning it will stick to its plan to end its asset purchase program this month despite expectations the central bank will lower its economic growth and inflation forecasts. The ECB also maintained its interest rate guidance to keep rates unchanged at least through the summer of 2019 but will reinvest maturing debt beyond that time frame. The message may be dovish enough for markets, but not too much so as to increase anxiety around the economic outlook.
Initial jobless claims fall. Weekly initial unemployment claims came in at 206K, below the 226K expected and last week’s revised 233K. The four-week moving avg., a better gauge of labor market trends, also declined ~4K to ~225K after increasing nine of the past 10 weeks. Continuing claims (1661K) came in above expectations (1649K), but have trended lower this year and remain near year-to-date lows. Overall, the data suggest the labor market, and by extension the U.S. economy, remain in good shape.