NOTE: Apart from updating some old posts, I have left Forex Factory, so don't expect replies to your posts. You can find an index to all my indicators and posts here.
CSM (currency strength meter histogram indicator)
I decided that the CSM indicator was worthy of its own thread, especially as post #1 can be updated forever with new versions. Everything was getting scattered and hard to find; I've attempted to gather everything up and include it here in this one post. Hence it will be a long one.
I've made another small enhancement, the ShowValues setting has been replaced by ValuesSpacing, explained in the instructions below.
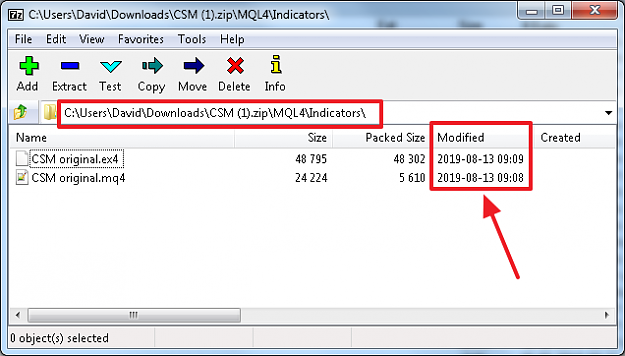
Here is the latest CSM and all of the parameter files ('p-files'). I've included .mq4 source code but you'll need do do this first, otherwise it will compile with a zillion errors. To avoid any problems, download the .ex4 file only.
The CSM indicator isn't a holy grail, it lags sentiment just like every other price-derived strength meter (more info here).
Note that when you first load the indicator, it must download all of the required data (for the timeframes that you've selected) from your broker's server. This might take several minutes, especially if you've asked for several pairs/instruments, and time frames, to be collated. You can have an app like this download this data, if you prefer.
Disclaimer: As always, this software is provided freely and may not be sold or distributed commercially. Code is offered on an 'as is, take it or leave it' basis with no guarantee that it works as you believe that it should. Download and use it at your own risk; I accept no liability for any computer damage or financial losses.
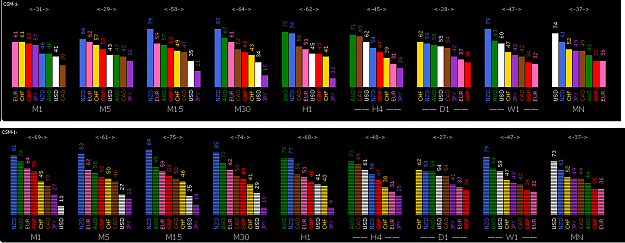
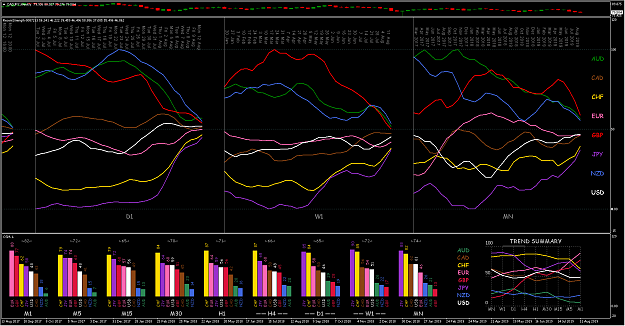
The comparison below highlights one of the more recently added features: the first screenshot shows the indicator in its previous 'regular' mode; and the second demonstrates the feature where histogram bar colors may be altered depending on the currency values (in the displayed shot, bars with values between 30 and 70 have been colored gray, so that only the strongest and weakest currencies are highlighted). ______________________
Parameter Settings
ParameterFile: this is explained below (see the Parameter Files section below) .
CurrencyPairs: Enter the values of the pairs that you want the indicator to consider, separated by commas. Permissible abbreviations are: A=AUD; C=CAD; E=EUR; F=CHF; G=GBP; J=JPY; N=NZD; U=USD; H=HKD; S=SGD; Z=ZAR. So you could type GU or gu instead of GBPUSD, for example. Note that these are the pairs that will be used in the calculations to gain a relative strength/weakness value for AUD, CAD, CHF, EUR, GBP, JPY, NZD and USD. Exotics, metals, cryptos etc that are offered by your broker can be included in the strength/weakness calculations for these 8 major currencies, but histograms are plotted for the 8 majors only.
CurrencySuffix: To further save repetitive typing, CurrencySuffix gets appended to the end of every entered pair. Hence if your broker is offering pairs named EURUSD.pro, GBPJPY.pro, etc, you could enter CurrencyPairs as eu, gj, etc, and CurrencySuffix as .pro
TimeFrames: the timeframes for which you want histograms to be displayed. Valid values are M1, M5, H1, D1, MN, etc. The histograms will plot, from left to right across your screen, in the order that you specify here.
NumberOfCandles:
ApplySmoothing:
TriangularWeighting:
These are explained in the 'Calculation' section below.
HistoricalShift: Shows what the histograms would have looked like X candles ago (in each timeframe). This is really only meaningful for one timeframe to be considered. For example, entering -5 would show what the histogram looked like 5 hours ago on the H1 TF, but 20 hours ago (5 x 4 hours) on the H4 TF. Enter 0 to see the current histograms on all TFs.
SortMethod: Enter D to have the histograms in each timeframe plot in descending order of value (strongest currency on the left, weakest on the right). Enter A to have the histograms in each timeframe plot in ascending order of value (weakest currency on the left, strongest on the right). Leave the setting blank and the currencies will be displayed in alphabetical order.
ValuesSpacing: typing a value > 15 moves the displayed values further away from the top of the histogram bar; a value < 15 moves it nearer. A value of 0 stops the values from being displayed at all.
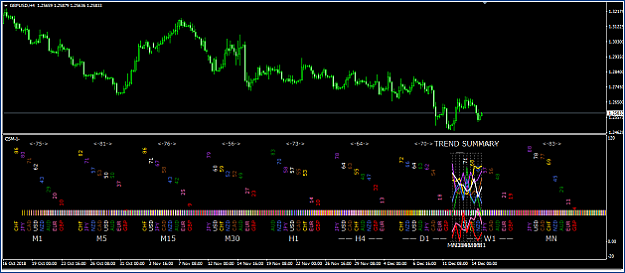
FontName: used for plotting the histograms, this should be either CSM or Placard MT Condensed, which are available in the Fonts folder in the zip file. For help with installing fonts, see this. The histogram is actually the letter 'I' repeated many times, after having been rotated onto its side. You can try using other fonts, but those two are the best that I've found. The screenshot below shows the difference in the histograms using the 'CSM.TTF' font (above) and the 'PLCC__.TTF' (Placard MT Condensed) font (below).
NOTE: If the plotted histograms look something like those shown below, then you probably haven't installed these fonts correctly:
FontSize: the size of the font that will be used for plotting the histograms. If you adjust this, you will probably need to also adjust the HorizSpacing to maintain a suitable distance between the histogram bars.
SeparateWindow: if TRUE, the histograms will plot in their own window; if FALSE, the histograms will plot in the main chart window.
HorizPos/VertPos: the histograms plot in a fixed screen position, i.e. they don't move with the candles. The HorizPos/VertPos settings represent the starting point, in pixels, for the first histogram TimeFrame to be plotted.
HorizSpacing: the spacing, in pixels, between each histogram bar.
Colors_AUD thru Colors_USD: the current version of CSM plots histograms for these 8 currencies only. You can now have different colors for different ranges of values for each histogram bar. For example, if you want the USD bar to display as White only when the strength value > 80 or <= 20, and DimGray otherwise, you would type into USD_colors: 100,White,80,DimGray,20,White,-1
In other words, values and valid color names must be typed alternately, separated by commas, with the values in descending order, starting from 100 and ending with -1. Since the color 'White' appears between 100 and 80, the histogram will plot as White for USD, if the histogram value is between 80 and 100, and so forth. You can specify up to 20 colors (41 entries). Colors may be entered as (i) valid MT4 tokens (Orange, DarkGoldenrod, DeepSkyBlue, etc); or (ii) RGB entries like r60g45b117 with each value between 0 and 255, and the R, G and B values in any order (if omitted, the Red/Green/Blue component is assumed to be zero); or (iii) as the hexadecimal representation (00 thru ff) 0xaabbcc, where aa is the Blue component, bb Green and cc Red; or (iv) a decimal number that is equal to (Blue x 255 x 255) + (Green x 255) + Red. See the chart here for more info. And/or download a free, handy color selector tool like this one.
Text Font/Size/Color: these determine the font/size/color of the text printed under the histograms.
RefreshPeriod: determines how often the histogram values are recalculated and replotted. Entries are explained in detail here.
UniqueID: you need to specify a different UniqueID for each instance of CSM on the same chart.
OutputFilename: to disable this facility, leave the setting blank. Otherwise output will be sent to a file of the name you specify in the ..../MQL4/Files folder. The file gets overwritten with fresh data every RefreshPeriod. You can specify a subfolder (under the Files folder) by entering something like subfolder\filename. You can embed the chart symbol or the date/time in the file name by including [sym] or [dt], respectively, in the filename. The output file could be read by an EA, so that currency strength values can be used to contribute to the EA's decision making process. The format of the output file is fixed, and looks like this:
OutputGlobals: if set to TRUE, CSM will also output all current histogram values to Global variables, for use in an EA (as an alternative to outputting the values to a file). The name of each global will be CSM-[UniqueID]-[timeframe]-[currencyID], e.g. CSM-1-M15-USD. These are updated once every RefreshPeriod. If FALSE, Global variables are not used.
HighlightBox: if TRUE, the H4/D1/W1 timeframe names are underlined (these are the timeframes that I tend to study). If FALSE, they are not underlined.
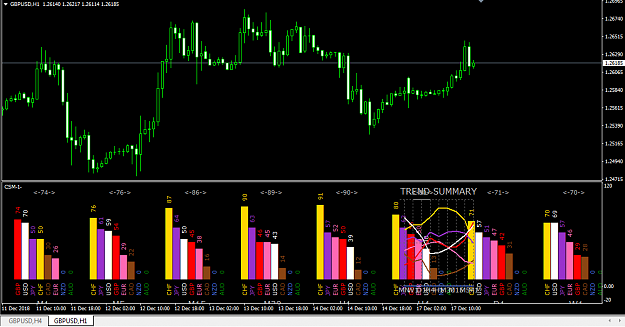
DisplaySpread: Another new feature is the little numbers that look like <-n-> which represent the 'spread' between the highest and lowest currency values (may be +/-1 due to a rounding error). A spread of 60 or greater generally represents decent momentum if you pair the outermost currencies, on that timeframe. A value less than 40 tends to mean that the market as a whole is flat/rangebound. Set DisplaySpread to TRUE to enable this facility, FALSE to disable it.
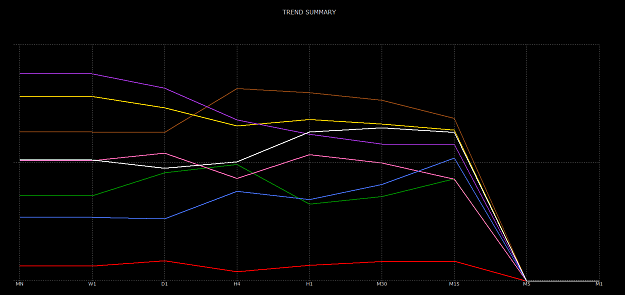
SummarySpacing/SummaryLevels: These settings enable/disable the 'Trend Summary' graph. Note that this graph is not plotted at a fixed screen location like the histograms; it moves with the candles, as you scroll the chart left/right. SummarySpacing determines the width between each timeframe plotted along the horizontal axis. Setting it to 0 disables the graph altogether. SummaryLevels determine the levels for which horizontal lines will be plotted. Enter increasing values between 0 and 100, separated by commas.
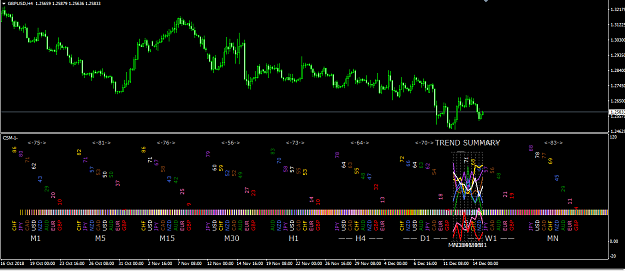
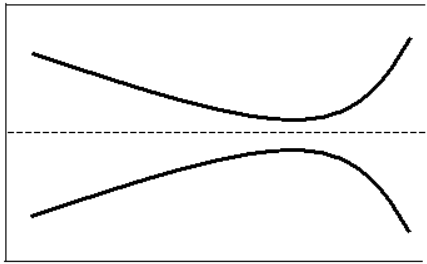
How to interpret the Trend Summary: it is merely a plot of the histogram values for each currency, from monthly down to M1. If you're looking to enter at the start of renewed momentum following a pullback in a longer term move, ideally you want to pair two currencies whose curves are located/shaped something like those shown here:
If you're having problems with the summary, try (1) using the arrow keys to scroll it to the right of the chart, (2) using the +/- keys to change the chart zoom and candle widths, (3) increasing or decreasing the indicator's SummarySpacing value, (4) turning MT4's Navigator, Market Watch, etc off to gain more screen space, (5) moving MT4's chart shift setting (the little triangle at the top right of the main chart) leftward to gain more space beyond the RHE, or (6) changing your monitor's resolution settings. Or if it's a nuisance, and you'd rather see only the histograms, simply set SummarySpacing to 0.
Calculation --- how the CSM histogram values are calculated
CSM works as an offshoot of the Giraia indicator. The original Giraia formula worked only on the D1 TF, and the currently forming candle. It checked where price currently was, in terms of the candle high and low, expressed as a percentage. For example, if price was currently at the high, the value returned was 100%; at the low, 0%; three quarters of the way up the candle, 75%; and so forth.
Then it converted this into a value between 0 and 9, thus:
Above 97%, value = 9
Between 90% and 97%, value = 8
Between 75% and 90%, value = 7
Between 60% and 75%, value = 6
Between 50% and 60%, value = 5
Between 40% and 50%, value = 4
Between 25% and 40%, value = 3
Between 10% and 25%, value = 2
Between 3% and 10%, value = 1
Less than 3%, value = 0
It processed all of the candles for each currency pair. Let’s say the pair currently being processed is USDCHF, and price is currently 64% of the way up the candle. Then it would assign a value of 6 for USD, and 9 minus 6 = 3 for CHF. Then it would repeat the same for all currency pairs (as specified in CurrencyPairs), average the results for each currency (not pair), and plot the values.
CSM extends this concept in at least four different ways:
1. You can specify NumberOfCandles. If set to 1, then this would work as the Giraia indy did, i.e. operate on the currently forming candle. If set to 2, it includes both the currently forming candle, and also the one immediately to the left; and so on. It uses the highest and lowest points across the 2 candle interval as 100% and 0%, respectively. Hence the value reflects where price currently is, relative to the highest and lowest point of the last n candles, where n is the NumberOfCandles setting.
2. The above assumes that ApplySmoothing = false. Setting this to true means that the entire process will be repeated, over the last NumberOfCandles candles, and the result averaged. For example, suppose NumberOfCandles is set to 4. Then if ApplySmoothing = true, the entire calculation (as explained previously) is run for each of NumberOfCandles = 1, 2, 3 and 4, and the four results averaged. This effectively means that, if ApplySmoothing = true, there is a higher weighting applied to the most recent candles. If set to false, it is simply where price is, relative to the high and low of the last n candles.
3. Instead of being restricted to the D1 TF, separate plots may be generated depending on the user’s choice of TimeFrames. Each TF is calculated completely independently of the others.
4. For whatever it's worth, I use NumberOfCandles=25, ApplySmoothing=true, TriangularWeighting=false. Here's how they work:
i) If ApplySmoothing=false, then TriangularWeighting is ignored, and the value calculated for each pair is simply the rise/fall from candle #25 (if NumberOfCandles=25) to the current price.
ii) If ApplySmoothing=true, and TriangularWeighting=false, then the rise/fall for each candle from candle #25 to candle #1, from that candle to the current price, is averaged to give a 'smoothed' value over the last 25 candles.
iii) If ApplySmoothing=true, and TriangularWeighting=true, then the rise/fall from candle #25 to current price is multiplied by 1, the rise/fall from candle #24 to current price is multiplied by 2, the rise/fall from candle #23 to current price is multiplied by 3, ........ the rise/fall from candle #1 to current price is multiplied by 25, before the averaging takes place. This attaches an even higher weighting to the most recent candles.
Parameter Files
To make changing the colors easier, you can use parameter files ('p-files'), which can be edited with a text editor like Windows' Notepad. For its settings to override the MT4 dialog settings, the file must be named as follows: if your entry in ParameterFile is xxx, then a file Presets---CSM.xxx must exist in the …/MQL4/Files folder that is formatted exactly as described below. If the file doesn't exist, e.g. setting to ParameterFile to NONE (and no file …/MQL4/Files/Presets---CSM.NONE exists), then the settings that you type into MT4's dialog box will apply.
To help you, I've included some dummy files in the zip, e.g. Presets---CSM.20, Presets---CSM.25 and Presets---CSM.30
These sample files will display all of the histogram bars in a dim gray color whenever the values are between 20/80, 25/75 or 30/70 respectively. So instead of having to retype all of the color settings, you could simply switch ParameterFile to 20, 25 or 30. I've also included a file Presets---CSM.1 named which causes the indicator to behave as it did previously. Or you can simply leave ParameterFile as NONE. I would suggest that, in order to ensure that you get your syntax exactly correct, you copy these files and then use them as a starting point for your entry values.
Parameter file format
The syntax in the p-file MUST follow the following rules and format:
parametername = value;
Parameter name must be spelled correctly (although it may be upper/lowercase, and include spaces or underscore characters (_) to improve readability), alphanumeric values must be enclosed in double quotes ("), and every line in the file MUST end with a semi-colon; failure to do so will cause unpredictable results.
The file may include 'comment' lines which will be ignored by the indicator. A comment line always begins with two slashes (//) and may then contain any text you wish. Again, it must end with a semi-colon. Comment lines can allow you to quickly switch a parameter from one value to another, e.g.
// parametername = value1;
parametername = value2;
which can be easily switched to
parametername = value1;
// parametername = value2;
Another use for comments is that you can 'comment out' a line, to allow you to change that particular setting using the MT4 dialog box, while the other parameters continue to obtain their values from the p-file. Then you can later easily restore the line in the p-file later if you need to. (Whereas restoration is not so easy if you delete the line altogether).
Note that after you've saved any changes to a p-file in Notepad, you must refresh the indicator for it to read in the changes from the p-file. The simplest way to refresh all of the indicators on your chart is to switch to a different timeframe, and then switch back again.
______________
This is a one off post, although I will be adding to it, whenever I make updates to the indicator. However, I wont be answering any questions; read the instructions above, and experiment with the indicator yourself. The source code is there if you want to make changes (e.g. add your own alerts, or rewrite it for MT5, .....). Or there are other strength meters or you to try in the links in the green typeface here.
Goodbye once again, LOL, and good luck everybody.
David
CSM (currency strength meter histogram indicator)
I decided that the CSM indicator was worthy of its own thread, especially as post #1 can be updated forever with new versions. Everything was getting scattered and hard to find; I've attempted to gather everything up and include it here in this one post. Hence it will be a long one.
I've made another small enhancement, the ShowValues setting has been replaced by ValuesSpacing, explained in the instructions below.
Here is the latest CSM and all of the parameter files ('p-files'). I've included .mq4 source code but you'll need do do this first, otherwise it will compile with a zillion errors. To avoid any problems, download the .ex4 file only.
Attached File(s)
The CSM indicator isn't a holy grail, it lags sentiment just like every other price-derived strength meter (more info here).
Note that when you first load the indicator, it must download all of the required data (for the timeframes that you've selected) from your broker's server. This might take several minutes, especially if you've asked for several pairs/instruments, and time frames, to be collated. You can have an app like this download this data, if you prefer.
Disclaimer: As always, this software is provided freely and may not be sold or distributed commercially. Code is offered on an 'as is, take it or leave it' basis with no guarantee that it works as you believe that it should. Download and use it at your own risk; I accept no liability for any computer damage or financial losses.
The comparison below highlights one of the more recently added features: the first screenshot shows the indicator in its previous 'regular' mode; and the second demonstrates the feature where histogram bar colors may be altered depending on the currency values (in the displayed shot, bars with values between 30 and 70 have been colored gray, so that only the strongest and weakest currencies are highlighted). ______________________
Parameter Settings
ParameterFile: this is explained below (see the Parameter Files section below) .
CurrencyPairs: Enter the values of the pairs that you want the indicator to consider, separated by commas. Permissible abbreviations are: A=AUD; C=CAD; E=EUR; F=CHF; G=GBP; J=JPY; N=NZD; U=USD; H=HKD; S=SGD; Z=ZAR. So you could type GU or gu instead of GBPUSD, for example. Note that these are the pairs that will be used in the calculations to gain a relative strength/weakness value for AUD, CAD, CHF, EUR, GBP, JPY, NZD and USD. Exotics, metals, cryptos etc that are offered by your broker can be included in the strength/weakness calculations for these 8 major currencies, but histograms are plotted for the 8 majors only.
CurrencySuffix: To further save repetitive typing, CurrencySuffix gets appended to the end of every entered pair. Hence if your broker is offering pairs named EURUSD.pro, GBPJPY.pro, etc, you could enter CurrencyPairs as eu, gj, etc, and CurrencySuffix as .pro
TimeFrames: the timeframes for which you want histograms to be displayed. Valid values are M1, M5, H1, D1, MN, etc. The histograms will plot, from left to right across your screen, in the order that you specify here.
NumberOfCandles:
ApplySmoothing:
TriangularWeighting:
These are explained in the 'Calculation' section below.
HistoricalShift: Shows what the histograms would have looked like X candles ago (in each timeframe). This is really only meaningful for one timeframe to be considered. For example, entering -5 would show what the histogram looked like 5 hours ago on the H1 TF, but 20 hours ago (5 x 4 hours) on the H4 TF. Enter 0 to see the current histograms on all TFs.
SortMethod: Enter D to have the histograms in each timeframe plot in descending order of value (strongest currency on the left, weakest on the right). Enter A to have the histograms in each timeframe plot in ascending order of value (weakest currency on the left, strongest on the right). Leave the setting blank and the currencies will be displayed in alphabetical order.
ValuesSpacing: typing a value > 15 moves the displayed values further away from the top of the histogram bar; a value < 15 moves it nearer. A value of 0 stops the values from being displayed at all.
FontName: used for plotting the histograms, this should be either CSM or Placard MT Condensed, which are available in the Fonts folder in the zip file. For help with installing fonts, see this. The histogram is actually the letter 'I' repeated many times, after having been rotated onto its side. You can try using other fonts, but those two are the best that I've found. The screenshot below shows the difference in the histograms using the 'CSM.TTF' font (above) and the 'PLCC__.TTF' (Placard MT Condensed) font (below).
NOTE: If the plotted histograms look something like those shown below, then you probably haven't installed these fonts correctly:
FontSize: the size of the font that will be used for plotting the histograms. If you adjust this, you will probably need to also adjust the HorizSpacing to maintain a suitable distance between the histogram bars.
SeparateWindow: if TRUE, the histograms will plot in their own window; if FALSE, the histograms will plot in the main chart window.
HorizPos/VertPos: the histograms plot in a fixed screen position, i.e. they don't move with the candles. The HorizPos/VertPos settings represent the starting point, in pixels, for the first histogram TimeFrame to be plotted.
HorizSpacing: the spacing, in pixels, between each histogram bar.
Colors_AUD thru Colors_USD: the current version of CSM plots histograms for these 8 currencies only. You can now have different colors for different ranges of values for each histogram bar. For example, if you want the USD bar to display as White only when the strength value > 80 or <= 20, and DimGray otherwise, you would type into USD_colors: 100,White,80,DimGray,20,White,-1
In other words, values and valid color names must be typed alternately, separated by commas, with the values in descending order, starting from 100 and ending with -1. Since the color 'White' appears between 100 and 80, the histogram will plot as White for USD, if the histogram value is between 80 and 100, and so forth. You can specify up to 20 colors (41 entries). Colors may be entered as (i) valid MT4 tokens (Orange, DarkGoldenrod, DeepSkyBlue, etc); or (ii) RGB entries like r60g45b117 with each value between 0 and 255, and the R, G and B values in any order (if omitted, the Red/Green/Blue component is assumed to be zero); or (iii) as the hexadecimal representation (00 thru ff) 0xaabbcc, where aa is the Blue component, bb Green and cc Red; or (iv) a decimal number that is equal to (Blue x 255 x 255) + (Green x 255) + Red. See the chart here for more info. And/or download a free, handy color selector tool like this one.
Text Font/Size/Color: these determine the font/size/color of the text printed under the histograms.
RefreshPeriod: determines how often the histogram values are recalculated and replotted. Entries are explained in detail here.
UniqueID: you need to specify a different UniqueID for each instance of CSM on the same chart.
OutputFilename: to disable this facility, leave the setting blank. Otherwise output will be sent to a file of the name you specify in the ..../MQL4/Files folder. The file gets overwritten with fresh data every RefreshPeriod. You can specify a subfolder (under the Files folder) by entering something like subfolder\filename. You can embed the chart symbol or the date/time in the file name by including [sym] or [dt], respectively, in the filename. The output file could be read by an EA, so that currency strength values can be used to contribute to the EA's decision making process. The format of the output file is fixed, and looks like this:
Inserted Code
TF , AUD, CAD, CHF, EUR, GBP, JPY, NZD, USD
M1 ,  36,  71,  30,  47,  15,  70,  67,  64
M5 ,  49,  56,  25,  64,  44,  49,  55,  59
M15,  51,  57,  33,  60,  54,  33,  54,  57
M30,  52,  67,  36,  52,  60,  37,  47,  48
H1 ,  60,  70,  30,  47,  64,  34,  47,  48
H4 ,  75,  71,  21,  31,  64,  39,  58,  39
D1 ,  80,  81,  21,  42,  58,  28,  56,  35
W1 ,  66,  86,  37,  61,  47,  14,  65,  24
MN ,  63,  76,  45,  65,  38,  19,  68,  26
OutputGlobals: if set to TRUE, CSM will also output all current histogram values to Global variables, for use in an EA (as an alternative to outputting the values to a file). The name of each global will be CSM-[UniqueID]-[timeframe]-[currencyID], e.g. CSM-1-M15-USD. These are updated once every RefreshPeriod. If FALSE, Global variables are not used.
HighlightBox: if TRUE, the H4/D1/W1 timeframe names are underlined (these are the timeframes that I tend to study). If FALSE, they are not underlined.
DisplaySpread: Another new feature is the little numbers that look like <-n-> which represent the 'spread' between the highest and lowest currency values (may be +/-1 due to a rounding error). A spread of 60 or greater generally represents decent momentum if you pair the outermost currencies, on that timeframe. A value less than 40 tends to mean that the market as a whole is flat/rangebound. Set DisplaySpread to TRUE to enable this facility, FALSE to disable it.
SummarySpacing/SummaryLevels: These settings enable/disable the 'Trend Summary' graph. Note that this graph is not plotted at a fixed screen location like the histograms; it moves with the candles, as you scroll the chart left/right. SummarySpacing determines the width between each timeframe plotted along the horizontal axis. Setting it to 0 disables the graph altogether. SummaryLevels determine the levels for which horizontal lines will be plotted. Enter increasing values between 0 and 100, separated by commas.
How to interpret the Trend Summary: it is merely a plot of the histogram values for each currency, from monthly down to M1. If you're looking to enter at the start of renewed momentum following a pullback in a longer term move, ideally you want to pair two currencies whose curves are located/shaped something like those shown here:
Attached Image

If you're having problems with the summary, try (1) using the arrow keys to scroll it to the right of the chart, (2) using the +/- keys to change the chart zoom and candle widths, (3) increasing or decreasing the indicator's SummarySpacing value, (4) turning MT4's Navigator, Market Watch, etc off to gain more screen space, (5) moving MT4's chart shift setting (the little triangle at the top right of the main chart) leftward to gain more space beyond the RHE, or (6) changing your monitor's resolution settings. Or if it's a nuisance, and you'd rather see only the histograms, simply set SummarySpacing to 0.
Calculation --- how the CSM histogram values are calculated
CSM works as an offshoot of the Giraia indicator. The original Giraia formula worked only on the D1 TF, and the currently forming candle. It checked where price currently was, in terms of the candle high and low, expressed as a percentage. For example, if price was currently at the high, the value returned was 100%; at the low, 0%; three quarters of the way up the candle, 75%; and so forth.
Then it converted this into a value between 0 and 9, thus:
Above 97%, value = 9
Between 90% and 97%, value = 8
Between 75% and 90%, value = 7
Between 60% and 75%, value = 6
Between 50% and 60%, value = 5
Between 40% and 50%, value = 4
Between 25% and 40%, value = 3
Between 10% and 25%, value = 2
Between 3% and 10%, value = 1
Less than 3%, value = 0
It processed all of the candles for each currency pair. Let’s say the pair currently being processed is USDCHF, and price is currently 64% of the way up the candle. Then it would assign a value of 6 for USD, and 9 minus 6 = 3 for CHF. Then it would repeat the same for all currency pairs (as specified in CurrencyPairs), average the results for each currency (not pair), and plot the values.
CSM extends this concept in at least four different ways:
1. You can specify NumberOfCandles. If set to 1, then this would work as the Giraia indy did, i.e. operate on the currently forming candle. If set to 2, it includes both the currently forming candle, and also the one immediately to the left; and so on. It uses the highest and lowest points across the 2 candle interval as 100% and 0%, respectively. Hence the value reflects where price currently is, relative to the highest and lowest point of the last n candles, where n is the NumberOfCandles setting.
2. The above assumes that ApplySmoothing = false. Setting this to true means that the entire process will be repeated, over the last NumberOfCandles candles, and the result averaged. For example, suppose NumberOfCandles is set to 4. Then if ApplySmoothing = true, the entire calculation (as explained previously) is run for each of NumberOfCandles = 1, 2, 3 and 4, and the four results averaged. This effectively means that, if ApplySmoothing = true, there is a higher weighting applied to the most recent candles. If set to false, it is simply where price is, relative to the high and low of the last n candles.
3. Instead of being restricted to the D1 TF, separate plots may be generated depending on the user’s choice of TimeFrames. Each TF is calculated completely independently of the others.
4. For whatever it's worth, I use NumberOfCandles=25, ApplySmoothing=true, TriangularWeighting=false. Here's how they work:
i) If ApplySmoothing=false, then TriangularWeighting is ignored, and the value calculated for each pair is simply the rise/fall from candle #25 (if NumberOfCandles=25) to the current price.
ii) If ApplySmoothing=true, and TriangularWeighting=false, then the rise/fall for each candle from candle #25 to candle #1, from that candle to the current price, is averaged to give a 'smoothed' value over the last 25 candles.
iii) If ApplySmoothing=true, and TriangularWeighting=true, then the rise/fall from candle #25 to current price is multiplied by 1, the rise/fall from candle #24 to current price is multiplied by 2, the rise/fall from candle #23 to current price is multiplied by 3, ........ the rise/fall from candle #1 to current price is multiplied by 25, before the averaging takes place. This attaches an even higher weighting to the most recent candles.
Parameter Files
To make changing the colors easier, you can use parameter files ('p-files'), which can be edited with a text editor like Windows' Notepad. For its settings to override the MT4 dialog settings, the file must be named as follows: if your entry in ParameterFile is xxx, then a file Presets---CSM.xxx must exist in the …/MQL4/Files folder that is formatted exactly as described below. If the file doesn't exist, e.g. setting to ParameterFile to NONE (and no file …/MQL4/Files/Presets---CSM.NONE exists), then the settings that you type into MT4's dialog box will apply.
To help you, I've included some dummy files in the zip, e.g. Presets---CSM.20, Presets---CSM.25 and Presets---CSM.30
These sample files will display all of the histogram bars in a dim gray color whenever the values are between 20/80, 25/75 or 30/70 respectively. So instead of having to retype all of the color settings, you could simply switch ParameterFile to 20, 25 or 30. I've also included a file Presets---CSM.1 named which causes the indicator to behave as it did previously. Or you can simply leave ParameterFile as NONE. I would suggest that, in order to ensure that you get your syntax exactly correct, you copy these files and then use them as a starting point for your entry values.
Parameter file format
The syntax in the p-file MUST follow the following rules and format:
parametername = value;
Parameter name must be spelled correctly (although it may be upper/lowercase, and include spaces or underscore characters (_) to improve readability), alphanumeric values must be enclosed in double quotes ("), and every line in the file MUST end with a semi-colon; failure to do so will cause unpredictable results.
The file may include 'comment' lines which will be ignored by the indicator. A comment line always begins with two slashes (//) and may then contain any text you wish. Again, it must end with a semi-colon. Comment lines can allow you to quickly switch a parameter from one value to another, e.g.
// parametername = value1;
parametername = value2;
which can be easily switched to
parametername = value1;
// parametername = value2;
Another use for comments is that you can 'comment out' a line, to allow you to change that particular setting using the MT4 dialog box, while the other parameters continue to obtain their values from the p-file. Then you can later easily restore the line in the p-file later if you need to. (Whereas restoration is not so easy if you delete the line altogether).
Note that after you've saved any changes to a p-file in Notepad, you must refresh the indicator for it to read in the changes from the p-file. The simplest way to refresh all of the indicators on your chart is to switch to a different timeframe, and then switch back again.
______________
This is a one off post, although I will be adding to it, whenever I make updates to the indicator. However, I wont be answering any questions; read the instructions above, and experiment with the indicator yourself. The source code is there if you want to make changes (e.g. add your own alerts, or rewrite it for MT5, .....). Or there are other strength meters or you to try in the links in the green typeface here.
Goodbye once again, LOL, and good luck everybody.
David


