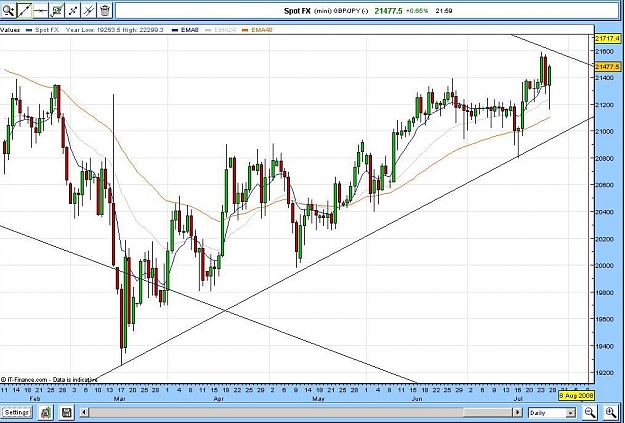
I have been bullish on usdjpy and gbpjpy for a while now. Here is a chart of GBPJPY. I see a possible head and shoulders formed now. Head and shoulders are circled, The pink line is the distance from the tip of the head to the neckline, which shows an area price can be expected to reach give or take a couple hundred pips. The blue line is where I will look for entries risking more of my account and also taking trades at newer highs risking less of my account.
Another thing I would like to point out. Something I have looking at on my charts are, the distance between peaks and valleys in price. Just like price action and and patterns, history repeats itself. Notice on this chart, the green lines next to the blue trendline. All those little green lines are the same size. The first 2 lines are very close to being right on where price hit the trendline. If this is a head and shoulders, price will be going up for a while and I will be watching to see if the next 2 green lines are close to where price retraces to the trendline before proceeding to make newer highs.
Another thing I would like to point out. Something I have looking at on my charts are, the distance between peaks and valleys in price. Just like price action and and patterns, history repeats itself. Notice on this chart, the green lines next to the blue trendline. All those little green lines are the same size. The first 2 lines are very close to being right on where price hit the trendline. If this is a head and shoulders, price will be going up for a while and I will be watching to see if the next 2 green lines are close to where price retraces to the trendline before proceeding to make newer highs.
Attached Image

JOHN 3:16