Hey,
My name is Varun, you can find out more about me and my system Forex Dynamite X' on trading system thread. Since the system was very basic I had modified it for prices entry and exit and also some visual roadblocks to eliminate bad trades, since the indicator I use are copyright... I cannot share it and hence I request any coder to help me create 3 simple indicators to put the system together in a very user-friendly manner and a great result for the community ... I look forward to your input.
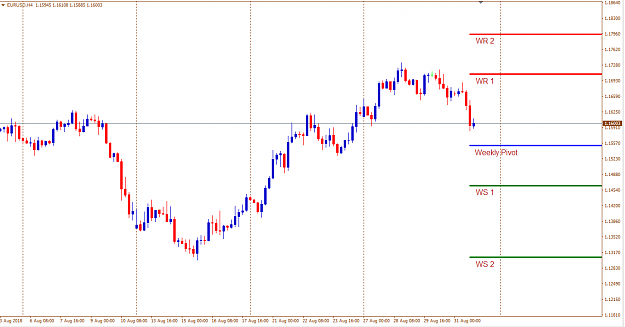
Indicator no 1. - Weekly Support and Resistance - I want the indicator to draw lines of different color, for pivot (blue line ), for support (Green line) and for Resistance (Red Line) ... the level should be calculated every week based on the following information ..
Pivot point (PP) = (High + Low + Close) / 3
First resistance (R1) = (2 x PP) – Low
First support (S1) = (2 x PP) – High
Second resistance (R2) = PP + (High – Low)
Second support (S2) = PP – (High – Low)
Third resistance (R3) = High + 2(PP – Low)
Third support (S3) = Low – 2(High – PP)
Indicator no 2 - Stochastic Oscillator, the oversold level is 20 and an overbought level is 80, I want the stoch to turn green when it enters the overbought level and red, when it enters an oversold level in between it, has to be white. the period for stochastic is 10,3,3 SMA Close.
Indicator no 3 - MACD I want a color MACD indicator of GREEN and Red with the period of following Fast EMA - 5 (Green), Slow EMA - 13 (Red), Signal SMA- 1 (WHITE)
I and everyone part of the thread will be very obliged for your contribution.
V
Forex Dynamite X'
My name is Varun, you can find out more about me and my system Forex Dynamite X' on trading system thread. Since the system was very basic I had modified it for prices entry and exit and also some visual roadblocks to eliminate bad trades, since the indicator I use are copyright... I cannot share it and hence I request any coder to help me create 3 simple indicators to put the system together in a very user-friendly manner and a great result for the community ... I look forward to your input.
Indicator no 1. - Weekly Support and Resistance - I want the indicator to draw lines of different color, for pivot (blue line ), for support (Green line) and for Resistance (Red Line) ... the level should be calculated every week based on the following information ..
Pivot point (PP) = (High + Low + Close) / 3
First resistance (R1) = (2 x PP) – Low
First support (S1) = (2 x PP) – High
Second resistance (R2) = PP + (High – Low)
Second support (S2) = PP – (High – Low)
Third resistance (R3) = High + 2(PP – Low)
Third support (S3) = Low – 2(High – PP)
Indicator no 2 - Stochastic Oscillator, the oversold level is 20 and an overbought level is 80, I want the stoch to turn green when it enters the overbought level and red, when it enters an oversold level in between it, has to be white. the period for stochastic is 10,3,3 SMA Close.
Indicator no 3 - MACD I want a color MACD indicator of GREEN and Red with the period of following Fast EMA - 5 (Green), Slow EMA - 13 (Red), Signal SMA- 1 (WHITE)
I and everyone part of the thread will be very obliged for your contribution.
V
Forex Dynamite X'
Precise Execution!