• Home
  • Forums
  • Trades
  • News
  • Calendar
  • Market
  • Brokers
  • Login
  • Join
  • User/Email: Password:
  • 3:52pm
Menu
  • Forums
  • Trades
  • News
  • Calendar
  • Market
  • Brokers
  • Login
  • Join
  • 3:52pm
Sister Sites
  • Metals Mine
  • Energy EXCH
  • Crypto Craft

Options

Bookmark Thread

First Page First Unread Last Page Last Post

Print Thread

Similar Threads

The 4 Hour Fozzy Method 233 replies

FOZZY Method CROSSES 808 replies

Fozzy Alt... one more approach to the Daily Fozzy Method 40 replies

My Daily Fozzy Trades 337 replies

Monthly Fozzy Method 9 replies

  • Trading Systems
  • /
  • Reply to Thread
  • Subscribe
  • 343
Attachments: The Daily Fozzy Method
Exit Attachments

The Daily Fozzy Method

  • Last Post
  •  
  • 1 78Page 91011 141
  • 1 Page 9 141
  •  
  • Post #161
  • Quote
  • Sep 23, 2006 11:43am Sep 23, 2006 11:43am
  •  brainjt
  • | Joined Feb 2006 | Status: brainjt | 376 Posts
thx- maybe Im tired
BJ
  • Post #162
  • Quote
  • Sep 23, 2006 2:16pm Sep 23, 2006 2:16pm
  •  accrete
  • Joined Jan 2006 | Status: Pips Ahoy! | 1,130 Posts
Hi there, on the RSI i posted it is the exact RSI,MA,BB that are in the original Fozzy method. To quote from post one the settings i have used in the indicator are:
Quote
Disliked
On each chart I have an 8 period RSI. I also have an 8 period MA of the RSI and Bollinger Bands with a 20 period setting, also on the RSI.
I have just placed them all in a simple hack of the Dynamic Zone RSI by Sniper, but all numbers are the same RSI8, (& RSI8dots for visual aid) Signal8, BBs20. Here is a quote/copy/paste of the exact code in the indicator posted. As you can see all settings are identical to those if one were to paste many indicators together:
Quote
Disliked
extern int RSIPeriod = 8;
extern int SignalMA_Period=8;
extern int SignalMA_Method=0; //0=sma,1=ema,2=smma,3=lwma
extern int BandPeriod = 20;
Hope that clears up any confusion. I had no intention of changing Fozzy's settings, just using a pretty-all-in-one indicator, as this was proven in past testing to be more reliable signals as opposed to plotting an RSI, then plotting BBs on the RSI, then plotting an MA on the RSI...to many things talking to one another...and it is all in one indicator on the DZRSI. If one will do some visual backtesting over the last year(s) with the indicators above/below on another you can see that the "single" indicator style, as opposed to the "many-pasted-together" style will not shift in strange ways as the many pasted together can at times. I'm just trying to work with a tool (with the origianal Fozzy settings) that seems to be more consistent in the signals it yeilds.

: ) Thom
  • Post #163
  • Quote
  • Sep 23, 2006 3:00pm Sep 23, 2006 3:00pm
  •  XLInvestor
  • | Joined Dec 2005 | Status: Member | 57 Posts
I am trying to set up MT4 with your charts and I cannot get the Bolinger bands to appear in the indicator window as per your original post. Any ideas why it will not drag from the chart to the indicator window
  • Post #164
  • Quote
  • Sep 23, 2006 4:29pm Sep 23, 2006 4:29pm
  •  kenmania
  • | Joined Sep 2006 | Status: Rookie Microcosmic Trader | 461 Posts
Hi XLInvestor,

Minute attached a nice template for MT4 here. Just follow the instructions on his post.
Is your SL my TP?
  • Post #165
  • Quote
  • Sep 23, 2006 5:42pm Sep 23, 2006 5:42pm
  •  jlowder
  • | Joined Jul 2006 | Status: Member | 225 Posts
Quoting accrete
Disliked
Hi all, i thought i'd share my version of the Dynamic RSI indicator that i use in my model, here is a screen shot of the indicator and some explanaitions as to what is what:

http://www.accrete.com/fx-mfbtm/RSIexample.gif

You can go ahead and add the median 20MA to get the centerline of the bollinger bands if you wish by dragging a standard MA indicator onto the RSI and setting the "Apply To" to the indicator. I use the +/-0.382 "zone" myself instead of a single median moving average as these areas will often act as S/R and i like to see a break through with momentum into this "zone". All colors, periods and moving averages are user definable.

Have fun. Use it any way you wish. I just hacked the standard Dynamic Zone RSI by adding an additional inner zone band and the signal line and dots on the RSI line. I like the dots as mentioned on the RSI line as i look for "V"s and inverted "V"s for possible reversals. Especialy when these patterns show up near the outside band area on the band side of the signal line.

Cheers, and happy trading.
Thom
Ignored
Thom,

Your version of the RSI appears to be one day off the normal one. When looking at the two setups on top of each other I notice that the standard RSI crosses a full grid before yours does. I'm using 8,8,1,20 for the settings. Am I just not interpreting this correctly?

Jason
  • Post #166
  • Quote
  • Sep 23, 2006 6:43pm Sep 23, 2006 6:43pm
  •  BeachBum
  • Joined Oct 2005 | Status: Trade the MAX System with me... | 1,995 Posts
Thom............

While I was writing about this, Jason posted his observations which are the same as mine. Earlier I setup a eur/usd Daily chart with the "fozzy" template provided by minute in post #25 and your most recent template (see post #158). The difference was immediately obvious, so I went back and checked the "signals" from your indicator window and the original "fozzy". In almost all cases your indicator gave the "trade signal" one Daily candle (or bar) later. This means some trades would have been missed, while others would have been entered a day late. Are we missing something here? Or have we drawn the wrong conclusion for some reason? At this point, I will continue to use the original template with the "pasted together indicators" rather than the DZRSI single indicator. So far, this method appears to be very successful.


Quoting jlowder
Disliked
Thom,

Your version of the RSI appears to be one day off the normal one. When looking at the two setups on top of each other I notice that the standard RSI crosses a full grid before yours does. I'm using 8,8,1,20 for the settings. Am I just not interpreting this correctly?

Jason
Ignored
  • Post #167
  • Quote
  • Sep 23, 2006 8:10pm Sep 23, 2006 8:10pm
  •  GreatYves
  • | Joined Aug 2006 | Status: AKA DareDevil | 527 Posts
Quoting pingpong
Disliked
Well i did get a fozzy cross this morning gmt on cable it wasnt fuzzy but very clear. However the price dipped and the cross uncrossed stopping me out boo hoo.

i wonder how often this actually happens and of course this is why it is not possible to get a realistic picture by backtesting it is only by forward testing that you can get an accurate measure as to any cross system.

I did put on a short trade on swissie late last night to waken to a healthy profit though.

Happy trading
Ignored
Make sure Bar is close (00:00) GMT. Curve wil then stop adjusting them self and new day begins..
I have check that cable cross was on 13 sept. You could have stay long since then +255 pips. Still no cross down. When you follow a system, stick to it's rules.
Harmonics and Pitchfork using korHarmonics from TradingArsenal
  • Post #168
  • Quote
  • Sep 23, 2006 8:21pm Sep 23, 2006 8:21pm
  •  GreatYves
  • | Joined Aug 2006 | Status: AKA DareDevil | 527 Posts
Quoting JBB
Disliked
Hi all,

Looking back at the charts I see that some crosses happened below middle BB line, heading south and produced good pips in downtrend. The same for crosses happened above middle BB, heading north, which gave actually great pips. Why those crosses is "not valid" by Fozzy's rules?

Forgive me if I sound silly, but why do we need BB? Just for it's middle line, or something else important that I don't see?

Thank you and good trades to all
Ignored
So then you know if market is oversold or overbought. Probability of good trade are at the extreme.
Harmonics and Pitchfork using korHarmonics from TradingArsenal
  • Post #169
  • Quote
  • Sep 23, 2006 10:03pm Sep 23, 2006 10:03pm
  •  accrete
  • Joined Jan 2006 | Status: Pips Ahoy! | 1,130 Posts
Hummmm, don't know on your observations. It's the original code that FXSniper's DZRSI with the addition of the inner BBand and the RSI dots that changed none of it's original functionality....and just changed the settings to match those w/the FM. Seems to work fine for me w/IBFX feed and it's accuracy to price action.

: ) Thom
  • Post #170
  • Quote
  • Sep 23, 2006 11:32pm Sep 23, 2006 11:32pm
  •  jlowder
  • | Joined Jul 2006 | Status: Member | 225 Posts
Quoting accrete
Disliked
Hummmm, don't know on your observations. It's the original code that FXSniper's DZRSI with the addition of the inner BBand and the RSI dots that changed none of it's original functionality....and just changed the settings to match those w/the FM. Seems to work fine for me w/IBFX feed and it's accuracy to price action.

: ) Thom
Ignored
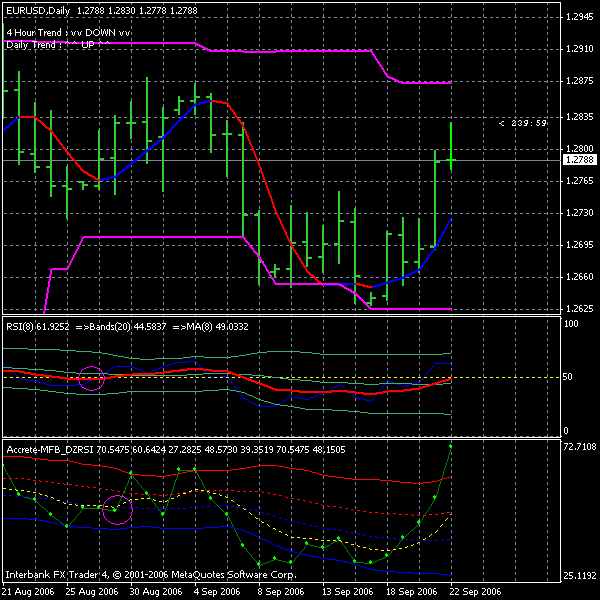
I'm using IBFX as well. Take a look at the attached picture. I circled just one example of several discrepancies on this chart.

Jason
Attached Image
  • Post #171
  • Quote
  • Sep 24, 2006 3:00pm Sep 24, 2006 3:00pm
  •  BeachBum
  • Joined Oct 2005 | Status: Trade the MAX System with me... | 1,995 Posts
I have the same differences on my charts with two different brokers, IBFX and FXDD.


Quoting jlowder
Disliked
I'm using IBFX as well. Take a look at the attached picture. I circled just one example of several discrepancies on this chart.

Jason
Ignored
  • Post #172
  • Quote
  • Sep 24, 2006 9:27pm Sep 24, 2006 9:27pm
  •  heriyadi
  • | Joined Jul 2006 | Status: Member | 54 Posts
Quoting accrete
Disliked
Hummmm, don't know on your observations. It's the original code that FXSniper's DZRSI with the addition of the inner BBand and the RSI dots that changed none of it's original functionality....and just changed the settings to match those w/the FM. Seems to work fine for me w/IBFX feed and it's accuracy to price action.

: ) Thom
Ignored
Oke I found why this thing happen, in your indicator, you put dot when the chart opening price. Mean while in the original the line is still move up and down until the chart is close, so actually you must put the dot in last price for that bar not for the opening.
  • Post #173
  • Quote
  • Sep 24, 2006 10:58pm Sep 24, 2006 10:58pm
  •  accrete
  • Joined Jan 2006 | Status: Pips Ahoy! | 1,130 Posts
Quoting heriyadi
Disliked
Oke I found why this thing happen, in your indicator, you put dot when the chart opening price. Mean while in the original the line is still move up and down until the chart is close, so actually you must put the dot in last price for that bar not for the opening.
Ignored
Still not quite following things, remember this is a fine indicator from a fellow PipSter FXSniper, and except for adding a duplicate of the RSI but showing dots and the inner BB it is stock. The line of code for RSIdot is as follows:
Quote
Disliked
RSIBuf[i] = iRSI(NULL,0,RSIPeriod,MODE_CLOSE,i);
MA = 0;


for(int j=i; j<I+BANDPERIOD; p j++) {<> RSI[j-i] = RSIBuf[j];
MA += RSIBuf[j]/BandPeriod;
}
{
RSIBufdot[i] = iRSI(NULL,0,RSIPeriod,MODE_CLOSE,i);
}
If one follows the price, the RSIdot is there at the end of the forming line right where price is. What am i not seeing? Still confused. Please realize i'm not a coder, just following the suggestions of my mentor and placed the dots there for an indication of possible reversals. My sincere apologies for mucking up the waters if they have been. Just trying to be helpful with what has been a help to me.

: ) Thom
  • Post #174
  • Quote
  • Sep 25, 2006 12:17am Sep 25, 2006 12:17am
  •  jlowder
  • | Joined Jul 2006 | Status: Member | 225 Posts
Quoting accrete
Disliked
Still not quite following things, remember this is a fine indicator from a fellow PipSter FXSniper, and except for adding a duplicate of the RSI but showing dots and the inner BB it is stock. The line of code for RSIdot is as follows: If one follows the price, the RSIdot is there at the end of the forming line right where price is. What am i not seeing? Still confused. Please realize i'm not a coder, just following the suggestions of my mentor and placed the dots there for an indication of possible reversals. My sincere apologies for mucking up the waters if they have been. Just trying to be helpful with what has been a help to me.

: ) Thom
Ignored
Hi Thom,

It's not the dots that are causing my confusion. The RSI in yours crosses the 8 MA at an entirely different place than the stock RSI crosses the stock 8MA.

No problems, just trying to clarify why the two indicators are different.

Jason
  • Post #175
  • Quote
  • Sep 25, 2006 12:54am Sep 25, 2006 12:54am
  •  johoma
  • | Joined May 2006 | Status: Member | 82 Posts
Could be wrong here as I haven't been playing with Accrete's indicator. However in post 162, I think it indicates that the 8MA is a sma, whereas Fozzy has indicated he uses an ema. Could that be your problem/difference?
Cheers
  • Post #176
  • Quote
  • Sep 25, 2006 1:17am Sep 25, 2006 1:17am
  •  accrete
  • Joined Jan 2006 | Status: Pips Ahoy! | 1,130 Posts
Quoting johoma
Disliked
Could be wrong here as I haven't been playing with Accrete's indicator. However in post 162, I think it indicates that the 8MA is a sma, whereas Fozzy has indicated he uses an ema. Could that be your problem/difference?
Cheers
Ignored
Ah Johoma, if that is the case it might be the difference. I place an SMA on the RSI as it is what John Bollinger recomends in his book "Bollinger on Bollinger Bands" when "Normalizing" an indicator with his Bands...I figured the creator of the bands might have some insights that this fellow trader might not see at first viewing.

If one wishes to experiment, as i suggested in my post number 9, one can change the method of the ma to any of the standards. A "1" in place of the "0" will replace the default SMA with an EMA.

: ) Thom
  • Post #177
  • Quote
  • Sep 25, 2006 8:04am Sep 25, 2006 8:04am
  •  d0lf4
  • | Joined Aug 2006 | Status: Member | 4 Posts
Hi fozzy & accrete,

i am newbie in fx, and
thank you for your method and accrete's indicator.
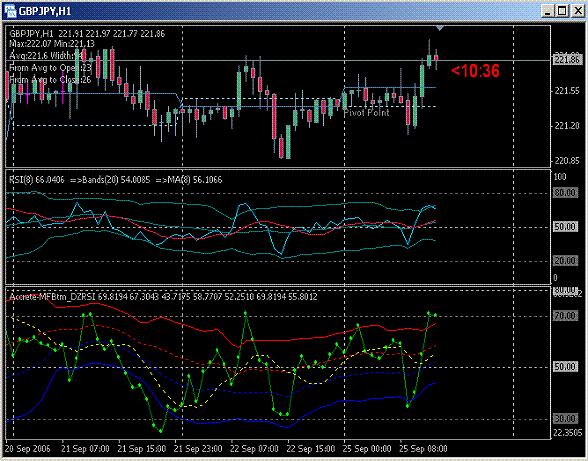
i use both for my intraday trading in real forex and betonmarket.
and i add some lines to your indicator to determine intraday's high/low.
not only that, i use both with ACD system and,
candlestick small body (hammer/shootingstar/spinningtops) to read the trend.

thank you guys, now i have two added weapons for trading.

regards,
d0lf4
Attached Image
  • Post #178
  • Quote
  • Sep 25, 2006 10:08am Sep 25, 2006 10:08am
  •  accrete
  • Joined Jan 2006 | Status: Pips Ahoy! | 1,130 Posts
Hi Dolf4, thx for the kudos on the "indicator" but with all the posts above you might have gathered that the jury is still out on it's accuracy. I do use the indicator at times on my daily chart these days, but it is not a primary tool in my arsenal. I just stopped by Fozzy's thread to say hello to my fellow traders...This is Fozzy's model, I'm just along for the ride : )

Good trading,
Thom
  • Post #179
  • Quote
  • Sep 25, 2006 10:53am Sep 25, 2006 10:53am
  •  d0lf4
  • | Joined Aug 2006 | Status: Member | 4 Posts
Quoting accrete
Disliked
Hi Dolf4, thx for the kudos on the "indicator" but with all the posts above you might have gathered that the jury is still out on it's accuracy. I do use the indicator at times on my daily chart these days, but it is not a primary tool in my arsenal. I just stopped by Fozzy's thread to say hello to my fellow traders...This is Fozzy's model, I'm just along for the ride : )

Good trading,
Thom
Ignored
in this thread i found the combination from fozzy and your DZRSI for my own trading tool. and i just want to say thank you for the idea.

best regards,
d0lf4
  • Post #180
  • Quote
  • Sep 25, 2006 6:58pm Sep 25, 2006 6:58pm
  •  heriyadi
  • | Joined Jul 2006 | Status: Member | 54 Posts
Hi, I know GBP/JPY is not major, but the daily range is quite high, so I like to play this pair.

From what I see, the daily Fozzy Method work for this pair too. My question is if you look G/J chart today (sorry I can't display a picture in here) the rsi already cross MA. Did we wait until today chart confirm, and open position tomorrow or we can open position today?

Thanks in advance.

Heriyadi
  • Trading Systems
  • /
  • The Daily Fozzy Method
  • Reply to Thread
    • 1 78Page 91011 141
    • 1 Page 9 141
0 traders viewing now
  • More
Top of Page
  • Facebook
  • Twitter
About FF
  • Mission
  • Products
  • User Guide
  • Media Kit
  • Blog
  • Contact
FF Products
  • Forums
  • Trades
  • Calendar
  • News
  • Market
  • Brokers
  • Trade Explorer
FF Website
  • Homepage
  • Search
  • Members
  • Report a Bug
Follow FF
  • Facebook
  • Twitter

FF Sister Sites:

  • Metals Mine
  • Energy EXCH
  • Crypto Craft

Forex Factory® is a brand of Fair Economy, Inc.

Terms of Service / ©2021