Hi.
With the Auction Market Value Theory & Analytics EA you can trade in parallel 26 pairs.
This EA is rather unique, as it is capable to "follow the market", this means:
- no optimization is needed
- the same set of input parameters is good for all pairs
- you dont' need to change the set even if market conditions change. The same set will, in principle, be ok "forever"
This 3 unique features mean that the EA is not "manually adapted" to a specific pair in a specific timeframes, as it normally happens when you otpimize a pair in a past period with the Strategy Tester. Having a good backtest result when you use optimization is rather easy...but this doesn't mean that the EA will perform in the same way in the future, simply because market conditions can be very different!
This EA is really playing on another level...it adapts to the market variations and adapts to all the pairs without changing the input parameters!! In my long experience I have never seen such a feature in an EA, did you?
So, how is it possible that this EA "understands the market"?
The EA doesn't use "common" indicators, instead is based on a Theory, that is called Auction Market Value Theory & Analytics. So, let me tell you a bit about this.
It is well described here:https://www.forexfactory.com/showthread.php?t=482744, and is an evolution of Market Profile Theory (see here: https://www.forexfactory.com/showthr...528resources); it's based in understanding the market mood, that is in a sentence "is the present price far from the proper value that the market has in mind?"...it is not a day trader or scalping tecnique, it is rather a position technique. Normally positions are kept open for weeks.
Important to understand is the concept of Overlay in a specific Timeframe, in a few words it is an envelope of prices in the last days, and helps understanding where the value is and if the value is stable or not.
An Overlay is "Bracketing" when the price stays in a channel, almost if the price was "between brackets".
When you have Overlays Bracketing in different timeframes, it means that the price is wandering in the same channel since many days...this is a very interesting situation, as long stability in the market is often a signal for a future breakout.
Here is where my EA trades, looking for "too stable" conditions in specific bracketing patterns and waiting for them to explode! If they do, the EA uses a very smart tecnique for setting stoploss, take profit and trailing stop.
You will not find any pip to set such values in the EA, as the EA understands the best values to set them. If you run the EA, you will see that the stoploss is always hidden under a price support, the same with trailing stop.
I understand that if you are not familiar with Overlay and Market Profile, this explanation may seem a bit confusing, but I am available to try to explain a bit more, just send me a message.
Some hints:
- when testing, ONLY use M1 timeframe, it is mandatory for accuracy. If the testing is too slow, you can use "open prices only". You need at least 2 years of data with M1 and M30 timeframes.
- when running in a demo account, you can adjust the RATE parameter. That is the number of minutes for a refresh of all calculations, normally I keep it at 5. Of course you can also adjust the lot size (recommend 0.6 lot with an initial balance 10000 EUR, if balance is less just reduce the lot in proportion, e.g. balance 1000 EUR lot size 0.06).It is not necessary to change the other parameters, the EA has already a good set, just load the one in the .zip.
About my test results:
I've been using the same set that is included in the .zip, running a 15 months test (in M1, initial balance 10000) on all 26 securityes; as the EA is trading in parallel all 26 pairs, in order to simulate the behaviour you have to SUM the test results:
TOTAL Profit 21020 EUR, 100 trades OK, 34 trades NOK
% win 74.63%
av. profit 156.87
% profit 210%
DD: typically a pair has a DD below 10%, but you have to consider that normally more than on position are opened, so expect an even lower DD.
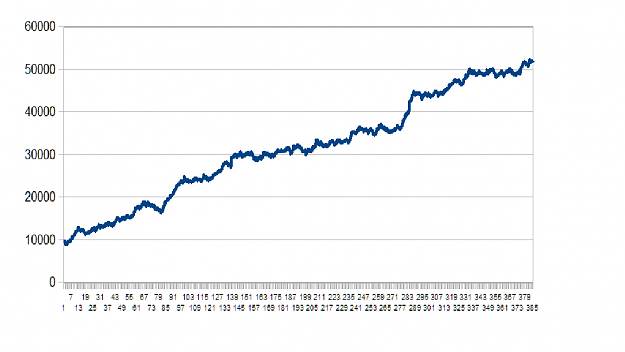
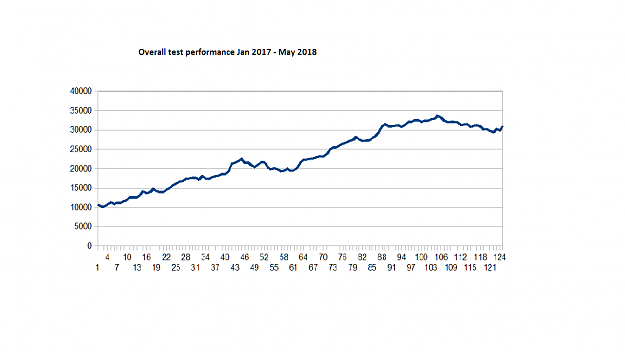
In one of the attached picture, you will find a graph that sums in time order all the test results. That is my best guess to predict future behaviour of the EA!
Some details more:
the EA looks for conditions where there is bracketing both on a "shorter" Overlay (with NUMERO_BARRE 30 mins length) and in "longer" Overlay (with MULTI*NUMERO_BARRE 30 min bars). In detail, the EA looks (e.g. buy) for conditions where the upperlayer of shorter Overlay is lower than upperlayer of longer Overlay (similar for sell). When Activitiy (see theory for definition) conditions are fulfilled (see below) the EA will open a Virtual Buy Order (it is not a market order!!) at the upperlimit of the longer Overlay(similar for sell). The virtual order opening is shown in the EXPERT tab. Then, if the price goes beyond the Virtual Order level for at least NMIN mins, a real buy order is opened (similar for sell). In a sentence, the EA looks for breakouts of the longer Overlay upper/lower limits. In the following points are described more in detail OV calculation general rules and EA behaviour.
1) the "brick" height, or step, used to calculate all Overlays is variable. Actually the step is equal to the 30 min 3 days average ATR, divided for a integer number (STEP_REF in input parameters). For instance if in a certain moment ATR is 70 points and the STEP_REF is 10, the step will be set at 7 points. You can see the present step in Expert tab, printed together with all other Activity parameters of the 3 days Overlay.
2) The Expert tab prints every RATE minutes all the parameters of Activity for securities in full bracketing condition (means both longer Overlay and shorter Overlay are in bracketing). The Activity is used to "fire" a Virtual stop, if bracketing conditions apply. The input parameter to set the Activity threshold is REF_ATC1 (max value 5), and it refers to the activity calculated comparing Overlay 3 days (last) with Overlay 3 days (GAP days ago, you can set this in input settings)
3) If you set UsaClose at true, an automatic OrderClose is sent when price is Higher than Trailing Level and Activity is higher than ACT_REF2.
4) Stop loss is automatic, no need for any input data. It will be set, for a Buy, at Lower Value Area level of last Overlay 3 days, similar for a Sell.
5) in order to consider the possible effects of volatility, you can use a larger stoploss. This also will be calculated automatically. In detail, if step (automatic calculation described above) is higher than fraz_atr, the stop loss will be moved in proportion. For instance, if in a certain moment step is 15 and fraz_atr is equal to 10, the stop loss will be 1.5 times greater. If you do not want to move the stop loss, just use a very high value for fraz_atr (for instance 100).
6) when stop loss is moved as describe in point 5), lot is reduced. For instance, if you use a LOT 1, in the example above lot will be reduced at 0.5. This is automatic and dynamic, lot size will be different for different orders depending on volatility and the input parameters you use.
7) Take Profit is calculated at fatt_tp times the stop loss width. For instance if in a certain moment stop loss is calculated at 1500 points and fatt_tp is 2.0, the Take Profit will be set at 3000 points.
8) Trailing stop starts when the price is higher than FTRAILING_STOP the Take profit level. In the example above, if FTRAILING_STOP is 0.5, trailing will start at 1500 points from price. At this same level, if you set UsaClose at true, automatic Close (activity dependent) will start. If you do not want trailing stop, jus set FTRAILING_STOP higher than 1 (e.g.2)
9) A Trailig Stop will be set at a level higher that FTRAILING_STEP only if there is an Overlay 3 days in bracketing, and will be set at the Value Area limit. That is, the stop loss wil be "protected" behind a strong support. It also means that if there is no Overlay 3 days bracketing, trailing stop will not be set. If this happens usually it means you are still in trend..that is good...but you can still send an automatic Close with UsaClose=true.
Of course you need a high RATE to monitor properly both Close and Trailing stop. In my real account I am using RATE=5.
10) Sometimes there not a nice breackout, and price just starts wandering in a lateral way for a weeks... If the price is lower than Trailing level and higher than open price, after GIORNI_ATTESA days it will be closed. I believe this is rather good, but if you do not want this just put a very high number for GIORNI_ATTESA (e.g. 1000)
other input settings:
a) ore_wait_bracketing: number of hours in wait before opening an order, after bracketing condition begins (normally set=0)
b) DIST: you can set an offset, in points, to open a virtual order higher or lower than upper/lower limit of the longer Overlay.
c) Usa_Close: is this is false, no OrderClose will be used
d)MIN_TPO, MAX_GAP: parameters for Overlay calculation, no need to change
e) RATE: every rate minutes all data are recalculated. I suggest to set it at 180 during testing (the smaller, the worse is performance) and at 5 in real operation (the higher, the better is accuracy)
Here a sample of how the EA performs using the SAME set on different securities:
http://fabiotest.ddns.net/eurusd_V53demo.htm
http://fabiotest.ddns.net/gbpusd_V53demo.htm
http://fabiotest.ddns.net/usdchf_V53demo.htm
http://fabiotest.ddns.net/usdcad_V53demo.htm
http://fabiotest.ddns.net/nzdjpy_V53demo.htm
http://fabiotest.ddns.net/audjpy_V53demo.htm
http://fabiotest.ddns.net/nzdchf.htm
http://fabiotest.ddns.net/audcad.htm
http://fabiotest.ddns.net/eurchf.htm
http://fabiotest.ddns.net/eurgbp.htm
http://fabiotest.ddns.net/gbpjpy.htm
http://fabiotest.ddns.net/nzdcad.htm
http://fabiotest.ddns.net/nzdchf.htm
Below I attach a -zip with the EA, sets, and detailed results
I also attach the overall results of the testing on 26 pairs, merged with a spreadsheet...here there is no MT4 optimization, so the behaviour in the past is a good guess of what could happen in the future, don't you agree?
cheers
With the Auction Market Value Theory & Analytics EA you can trade in parallel 26 pairs.
This EA is rather unique, as it is capable to "follow the market", this means:
- no optimization is needed
- the same set of input parameters is good for all pairs
- you dont' need to change the set even if market conditions change. The same set will, in principle, be ok "forever"
This 3 unique features mean that the EA is not "manually adapted" to a specific pair in a specific timeframes, as it normally happens when you otpimize a pair in a past period with the Strategy Tester. Having a good backtest result when you use optimization is rather easy...but this doesn't mean that the EA will perform in the same way in the future, simply because market conditions can be very different!
This EA is really playing on another level...it adapts to the market variations and adapts to all the pairs without changing the input parameters!! In my long experience I have never seen such a feature in an EA, did you?
So, how is it possible that this EA "understands the market"?
The EA doesn't use "common" indicators, instead is based on a Theory, that is called Auction Market Value Theory & Analytics. So, let me tell you a bit about this.
It is well described here:https://www.forexfactory.com/showthread.php?t=482744, and is an evolution of Market Profile Theory (see here: https://www.forexfactory.com/showthr...528resources); it's based in understanding the market mood, that is in a sentence "is the present price far from the proper value that the market has in mind?"...it is not a day trader or scalping tecnique, it is rather a position technique. Normally positions are kept open for weeks.
Important to understand is the concept of Overlay in a specific Timeframe, in a few words it is an envelope of prices in the last days, and helps understanding where the value is and if the value is stable or not.
An Overlay is "Bracketing" when the price stays in a channel, almost if the price was "between brackets".
When you have Overlays Bracketing in different timeframes, it means that the price is wandering in the same channel since many days...this is a very interesting situation, as long stability in the market is often a signal for a future breakout.
Here is where my EA trades, looking for "too stable" conditions in specific bracketing patterns and waiting for them to explode! If they do, the EA uses a very smart tecnique for setting stoploss, take profit and trailing stop.
You will not find any pip to set such values in the EA, as the EA understands the best values to set them. If you run the EA, you will see that the stoploss is always hidden under a price support, the same with trailing stop.
I understand that if you are not familiar with Overlay and Market Profile, this explanation may seem a bit confusing, but I am available to try to explain a bit more, just send me a message.
Some hints:
- when testing, ONLY use M1 timeframe, it is mandatory for accuracy. If the testing is too slow, you can use "open prices only". You need at least 2 years of data with M1 and M30 timeframes.
- when running in a demo account, you can adjust the RATE parameter. That is the number of minutes for a refresh of all calculations, normally I keep it at 5. Of course you can also adjust the lot size (recommend 0.6 lot with an initial balance 10000 EUR, if balance is less just reduce the lot in proportion, e.g. balance 1000 EUR lot size 0.06).It is not necessary to change the other parameters, the EA has already a good set, just load the one in the .zip.
About my test results:
I've been using the same set that is included in the .zip, running a 15 months test (in M1, initial balance 10000) on all 26 securityes; as the EA is trading in parallel all 26 pairs, in order to simulate the behaviour you have to SUM the test results:
TOTAL Profit 21020 EUR, 100 trades OK, 34 trades NOK
% win 74.63%
av. profit 156.87
% profit 210%
DD: typically a pair has a DD below 10%, but you have to consider that normally more than on position are opened, so expect an even lower DD.
In one of the attached picture, you will find a graph that sums in time order all the test results. That is my best guess to predict future behaviour of the EA!
Some details more:
the EA looks for conditions where there is bracketing both on a "shorter" Overlay (with NUMERO_BARRE 30 mins length) and in "longer" Overlay (with MULTI*NUMERO_BARRE 30 min bars). In detail, the EA looks (e.g. buy) for conditions where the upperlayer of shorter Overlay is lower than upperlayer of longer Overlay (similar for sell). When Activitiy (see theory for definition) conditions are fulfilled (see below) the EA will open a Virtual Buy Order (it is not a market order!!) at the upperlimit of the longer Overlay(similar for sell). The virtual order opening is shown in the EXPERT tab. Then, if the price goes beyond the Virtual Order level for at least NMIN mins, a real buy order is opened (similar for sell). In a sentence, the EA looks for breakouts of the longer Overlay upper/lower limits. In the following points are described more in detail OV calculation general rules and EA behaviour.
1) the "brick" height, or step, used to calculate all Overlays is variable. Actually the step is equal to the 30 min 3 days average ATR, divided for a integer number (STEP_REF in input parameters). For instance if in a certain moment ATR is 70 points and the STEP_REF is 10, the step will be set at 7 points. You can see the present step in Expert tab, printed together with all other Activity parameters of the 3 days Overlay.
2) The Expert tab prints every RATE minutes all the parameters of Activity for securities in full bracketing condition (means both longer Overlay and shorter Overlay are in bracketing). The Activity is used to "fire" a Virtual stop, if bracketing conditions apply. The input parameter to set the Activity threshold is REF_ATC1 (max value 5), and it refers to the activity calculated comparing Overlay 3 days (last) with Overlay 3 days (GAP days ago, you can set this in input settings)
3) If you set UsaClose at true, an automatic OrderClose is sent when price is Higher than Trailing Level and Activity is higher than ACT_REF2.
4) Stop loss is automatic, no need for any input data. It will be set, for a Buy, at Lower Value Area level of last Overlay 3 days, similar for a Sell.
5) in order to consider the possible effects of volatility, you can use a larger stoploss. This also will be calculated automatically. In detail, if step (automatic calculation described above) is higher than fraz_atr, the stop loss will be moved in proportion. For instance, if in a certain moment step is 15 and fraz_atr is equal to 10, the stop loss will be 1.5 times greater. If you do not want to move the stop loss, just use a very high value for fraz_atr (for instance 100).
6) when stop loss is moved as describe in point 5), lot is reduced. For instance, if you use a LOT 1, in the example above lot will be reduced at 0.5. This is automatic and dynamic, lot size will be different for different orders depending on volatility and the input parameters you use.
7) Take Profit is calculated at fatt_tp times the stop loss width. For instance if in a certain moment stop loss is calculated at 1500 points and fatt_tp is 2.0, the Take Profit will be set at 3000 points.
8) Trailing stop starts when the price is higher than FTRAILING_STOP the Take profit level. In the example above, if FTRAILING_STOP is 0.5, trailing will start at 1500 points from price. At this same level, if you set UsaClose at true, automatic Close (activity dependent) will start. If you do not want trailing stop, jus set FTRAILING_STOP higher than 1 (e.g.2)
9) A Trailig Stop will be set at a level higher that FTRAILING_STEP only if there is an Overlay 3 days in bracketing, and will be set at the Value Area limit. That is, the stop loss wil be "protected" behind a strong support. It also means that if there is no Overlay 3 days bracketing, trailing stop will not be set. If this happens usually it means you are still in trend..that is good...but you can still send an automatic Close with UsaClose=true.
Of course you need a high RATE to monitor properly both Close and Trailing stop. In my real account I am using RATE=5.
10) Sometimes there not a nice breackout, and price just starts wandering in a lateral way for a weeks... If the price is lower than Trailing level and higher than open price, after GIORNI_ATTESA days it will be closed. I believe this is rather good, but if you do not want this just put a very high number for GIORNI_ATTESA (e.g. 1000)
other input settings:
a) ore_wait_bracketing: number of hours in wait before opening an order, after bracketing condition begins (normally set=0)
b) DIST: you can set an offset, in points, to open a virtual order higher or lower than upper/lower limit of the longer Overlay.
c) Usa_Close: is this is false, no OrderClose will be used
d)MIN_TPO, MAX_GAP: parameters for Overlay calculation, no need to change
e) RATE: every rate minutes all data are recalculated. I suggest to set it at 180 during testing (the smaller, the worse is performance) and at 5 in real operation (the higher, the better is accuracy)
Here a sample of how the EA performs using the SAME set on different securities:
http://fabiotest.ddns.net/eurusd_V53demo.htm
http://fabiotest.ddns.net/gbpusd_V53demo.htm
http://fabiotest.ddns.net/usdchf_V53demo.htm
http://fabiotest.ddns.net/usdcad_V53demo.htm
http://fabiotest.ddns.net/nzdjpy_V53demo.htm
http://fabiotest.ddns.net/audjpy_V53demo.htm
http://fabiotest.ddns.net/nzdchf.htm
http://fabiotest.ddns.net/audcad.htm
http://fabiotest.ddns.net/eurchf.htm
http://fabiotest.ddns.net/eurgbp.htm
http://fabiotest.ddns.net/gbpjpy.htm
http://fabiotest.ddns.net/nzdcad.htm
http://fabiotest.ddns.net/nzdchf.htm
Below I attach a -zip with the EA, sets, and detailed results
I also attach the overall results of the testing on 26 pairs, merged with a spreadsheet...here there is no MT4 optimization, so the behaviour in the past is a good guess of what could happen in the future, don't you agree?
cheers
Attached Image (click to enlarge)
Attached File(s)