That was nearly two years ago. He is a nut job. Have I had a melt down. NO... He posted that on twatter... Sorry twitter.. Not sure what tablets he takes but they aint working.
Never in my life have I come across a phycho like him..
I will finally catch up with him. Just waiting for Barclays or the FCA (Financial Conduct Authority) or the police to get in touch then I can take it all to court. Then I will have his address LOL (He reported me to all three)
He can't hide forever.. He thinks he is being clever. I just let him get on with it and send the odd threatening message through his blog because it makes him MAD ;-)
He used to post in other forums and even they where crazy posts.... I found out his name is Francis and lives in the U.K
Not sure if Interpol will be informed if I go abroad.
Ah, wow. This thread is still going. I took a break from the forum given I couldn't tolerate the bickering.
Would anyone be able to help with coding this indicator? I want an alert when the RSI moves above/below the 20EMA. It only seems to notify me when the RSI just ticks up or down?
It would also be great to see 0 and 100 levels clearly if possible.
As an aside, I’ve been doing some of my own arduous research into currency fundamentals/strength.
I have been monitoring strength fluctuations across all major currencies every 5hours, recording the closes and aggregating the week ending results.
I am trying to find a way to better predict future movement to align with contrarian trades. It’s tough. Although I can confirm what Neil states is true, whatever is strongest one week, is usually weak the next.
Mean reversion seems to be a solid way to trade off these data points.
Ah, wow. This thread is still going. I took a break from the forum given I couldn't tolerate the bickering. Would anyone be able to help with coding this indicator? I want an alert when the RSI moves above/below the 20EMA. It only seems to notify me when the RSI just ticks up or down? It would also be great to see 0 and 100 levels clearly if possible. Thanks Paul {file}
Ignored
Post it in one of the coding threads. Someone will help you. I can only code pine for tradingview and not MT4.
Phycho stimpy Francis Finley is keeping busy again.
There isn't many of those names on the Electoral roll in the U.K.
Francis Finley - Frank Finley - F Finley.
In the U.K it is actually against the law to not be on the Electoral roll even if you don't vote. That's Governments for you.
He is posting on peoples twitter feeds that I'm a charlatan: (A person falsely claiming to have a special knowledge or skill)
One he posted too hasnt been on twitter for over two years. Is he a person of sound mind? NO.
Ok, he must of read the EUR/GBP linebreak 1 chart posted above (post 2275), as you can see the rsi2 on the daily went through the 70 (A buy) last friday well before New York closed.
72 pips so far or as some say here 722 pips. Well it's 722 points)
Nice going for a Charlatan.
Now today it has just gone up, up and more UP.
He even read that the GBPJPY had a 100% down trend starting in the Asian session (I'll-b-backs thread) and if he looked at the SSI on myfxbook, it was 83% long. That is one good sell order right there. So did he sell in the Asian session?
NO, he was just posting to his magical blog and posts on twitter..
A person of sound mind. NO!
GBPJPY down 0.86%
GBPUSD down 0.83%
EURGBP up 0.84%
I'll update them. All over 1% now.
He certainly has Schizophrenia...
Back to research. Have fun trading against the crowd ;-)
Yup, can happily say I’ve been profiting off eurgbp, gbpchf, gbpjpy ever since I started reading this thread.
I worried about what would happen if myfxbook goes down. You know what I realised?
Its absolutely correct that charts are a visual representation of human emotion/psychology. In an established down trend, the up ticks are usually retail buying, institutional bull traps and news fluctuations.
All you need to know is that the pound is weak, the JPY is consistent. Let retail traders try pick bottoms and go long, do the opposite when the reversal shows signs of exhaustion and you’re GOOD! You don’t really need indicators unless you’re automating the strategy.
That said, Neil, you bastard, let me test your EA
Is there any particular benefit to using line break charts?
I’ve been using the RSI2 for momentum and standard deviations to measure volatility, finally combined with retail money flow. Pretty much just using this to determine entry points. Can’t remember when I last had a loss. Could post my account that shows 80-90% success most weeks but I don’t want to end up in a blog.
Yup, can happily say I’ve been profiting off eurgbp, gbpchf, gbpjpy ever since I started reading this thread. I worried about what would happen if myfxbook goes down. You know what I realised? Its absolutely correct that charts are a visual representation of human emotion/psychology. In an established down trend, the up ticks are usually retail buying, institutional bull traps and news fluctuations. All you need to know is that the pound is weak, the JPY is consistent. Let retail traders try pick bottoms and go long, do the opposite when the reversal...
Ignored
lmfao I mega laughed at 'Neil you bastard'.... I have been named worse. Especailly on the magic blog lol
I will let you have it when its fully ready - By PM as it will not be posted here.
Disclaimer. It will be free forever. No date limit. Nothing. But wont post it here.
Im running it now but like you said wont post the results as it will look to good to be true.. It has some flaws still in it in the closing logic so wont give it you yet. I decided to just let it run the 3 months to see how it behaved. So far so good. It already had the GBPJPY trade open but opened another last night going into the Asian session.. Even though it mega dropped from there the spread was very large.. But OK. For one lot with the spread it went to -125 and now stands at +940.40. Pounds not Dollars.
No please don't post anything here as you will end up on the blog as well like Hanover was. He will name you a newbie that listens to me and will end up losing ;-)
Awesome going though.
Here is some magic... The GBPUSD stopped moving - Then started rising.. All you have to do is go to the GBPUSD thread and they all start buying.. Isnt that the classic trap..
They need more liquidity to sell more. Wait until retail idiots like stimpy buy it then they can start dumping it again. Its fascinating to watch. People are a creature of habit.
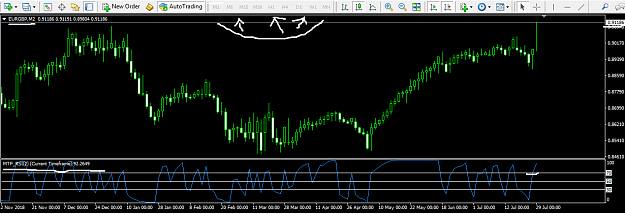
Is there any particular benefit to using line break charts?
Yes they are so powerful especially by using the linebreak chart setting 1 taken from the daily chart. They are a bit like renko charts and take time out of the equation and just use price. So no timeframe and just price action.
Here is an update - Earlier one posted in thread above.. I use the 70+ for a buy and 30 or below for a sell...
Above 50 get ready to buy (if rsi moving up). Below 50 get ready to sell. (if rsi moving down)
Oh according to phycho troll I have had a major meltdown again and threatened him or her. Not sure why he always says US.... Must be the voices in his head.
Major meltdown. what's one of those. All I did was post a few posts... What a bloody phycho
See its easy. SSI + RSI on linebreak 1 chart + currency strength + Money flow like Neogenesis mentioned. He will post again now still saying im lying ;-) P.S As you notice I DO NOT from now on show any real accounts as that is what started most of this shit off with trolls and psychos ;-) Like Davit says. That's my business. {image}
Ignored
You sir, are a god. Nothing else to say. My deepest gratitude for sharing this method with us. People will always criticize and talk shit but that's because they wasted years learning something that in the end its worthless and simply they envy your success. You have opened our eyes and taught us the truth. Long life to you my friend.
{quote} You sir, are a god. Nothing else to say. My deepest gratitude for sharing this method with us. People will always criticize and talk shit but that's because they wasted years learning something that in the end its worthless and simply they envy your success. You have opened our eyes and taught us the truth. Long life to you my friend.
Ignored
Thanks but im no God....
Remember : The day you planted the seed is not the day you eat the fruit. Be patient. Be humble.
Ok Im taking this all the way to the courts now.. Might live in Leeds but getting close...
He seriously needs professional help..
Now he just makes shit up over and over again. He must be one sad lonely person. He hasnt done anything worthwhile all day except keep posting shit on twitter and his blog.
How can I go apeshit when I aint even read any post....
See its easy. SSI + RSI on linebreak 1 chart + currency strength + Money flow like Neogenesis mentioned. He will post again now still saying im lying ;-) P.S As you notice I DO NOT from now on show any real accounts as that is what started most of this shit off with trolls and psychos ;-) Like Davit says. That's my business. {image}
Ignored
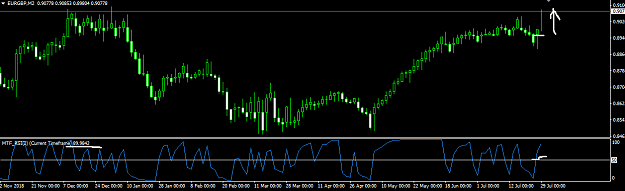
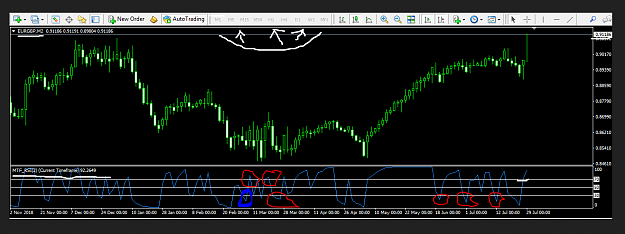
Thanks for all you share Neil, please, i will like you to share your experience on how you would have traded the red/blue highlighted on the graph below when the market is looking for direction. Thanks for your thoughts.
Attached Image (click to enlarge)
D labour of a fool wearieth him cos he doesn't know how to enta d city
{quote} Thanks for all you share Neil, please, i will like you to share your experience on how you would have traded the red/blue highlighted on the graph below when the market is looking for direction. Thanks for your thoughts. {image}
Ignored
I will have to go through the data to see if I had any trades then on the EURGBP.. I cant get what the SSI was on myfxbook on them dates.. I'll check what FF SSI was.
Only trade if at least 70% long then we trade short (70% short then we trade long - myfxbook data) but only under certain situations. The line break one chart taken from the daily chart, rsi must be above 70 for a long and under 30 for a short.
When there isnt much momentum like your red/blue you got in but at times it will reverse.. Nothing is infallible.. You will have losers but you have to cut those short and let the winners ride.
We have to determine how good is the trend.
For a better reading and trend on a candle chart the RSI on the daily can be very erratic at times.... I'll get an indicator written as the EA I use, uses this for trend strength.
The trend strength for the EURGBP right now is 93 out of 100.
Add the RSI/2 and the RSI/9 from the Monthly - Weekly - daily and H4 chart then divide by 8 to give a reading. Over 65 for a strong up trend and under 35 for a strong downtrend.
I don't trade all the time even though the retail are selling, I dont always go for the buy.
Good SSI over 70% - Currency strength and trend strength.
I'll post an indicator tomorrow that shows you the true strength of any pair.
Update. Your last three red circles... The SSI was over 80% sell, so it was buy only..... I will check the rest later.
{quote} I will have to go through the data to see if I had any trades then on the EURGBP.. I cant get what the SSI was on myfxbook on them dates.. I'll check what FF SSI was. Only trade if at least 70% long then we trade short (70% short then we trade long - myfxbook data) but only under certain situations. The line break one chart taken from the daily chart, rsi must be above 70 for a long and under 30 for a short. When there isnt much momentum like your red/blue you got in but at times it will reverse.. Nothing is infallible.. You will have losers...
Ignored
Many thanks for the clarification, it comes together. I appreciate. I will look forward to the indicator tomorrow. BTW thanks for recommending the currency flow indy from Don, its quite useful.
Cheers
D labour of a fool wearieth him cos he doesn't know how to enta d city
Is there any particular benefit to using line break charts? Yes they are so powerful especially by using the linebreak chart setting 1 taken from the daily chart. They are a bit like renko charts and take time out of the equation and just use price. So no timeframe and just price action. Here is an update - Earlier one posted in thread above.. I use the 70+ for a buy and 30 or below for a sell... Above 50 get ready to buy (if rsi moving up). Below 50 get ready to sell. (if rsi moving down) {image}
Ignored
Do you use this instead of regular candlestick charts?
I normally switch to Renko when I’ve a trade open, I could see this would be beneficial for trade management.
Wondering how much of this is stylistic vs performance based. As no doubt you’ll know, HLOC can be useful with inside/outside bars too.
Hmm...
Look forward to receiving the EA!
Thinking about the logic now. I could see how a line break chart could determine a key entry point, e.g market has an established down trend but is retracing up. Logic set to open a trade within a parameter of defined line breaks down, supported by currency strength, RSI crossing and SSI. Targets perhaps set by ATR/some advanced position scaling.
{quote} Thanks for all you share Neil, please, i will like you to share your experience on how you would have traded the red/blue highlighted on the graph below when the market is looking for direction. Thanks for your thoughts. {image}
Ignored
I am not Neil (obviously).
Basic technical analysis should have you wary of entering some of those longs, where the market has been recording lower lows and/or looking choppy.
April and before, I would probably only look to short. After May, I would only seek to be long.
As always, the trend is your friend. If indicators are determining your entry points and not confirming them, demo trade.
Macro trends last for significant periods of time. Wait for price action to validate your thoughts/signals before entering. Don’t chase the dragon...