Hi,
First off, I am a full-time trader and I have been trading in the currency market for more than four years now. As a long time lurker of this forum, I finally feel the need to participate in forums, as day-trading has gotten pretty boring. I have three very powerful strategies in my trading arsenal, and what better way to start than to share one of the strategies here. I wouldn’t call this an entirely mechanical system, as you need to use some discretion. I will be outlining some of the important factors that may need consideration before entering a trade based on this system, later in this post.
I call this system: A.M.G Waves
Timeframe: Any. But, I use 1Hr or higher to avoid whipsaws.
Pair: Any Currency Pair.
Indicator(s):
Stochastic Oscillator (8,3,3)
5 SMA
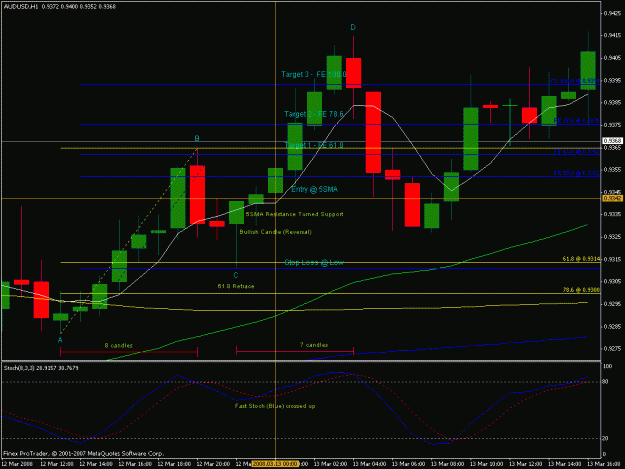
Before I give out the entry requirements, please take a look at the following picture. A setup only exists where the fib retracement of an impulse wave is 61.8 or 78.6. The idea behind this method is that provided AB wave retraces by 61.8% or 78.6%, it should equal the CD wave. Only look for setups that are in the direction of the bigger trend (ie: If you are looking at setups on the hourly, then only look for signals that are with the daily trend).
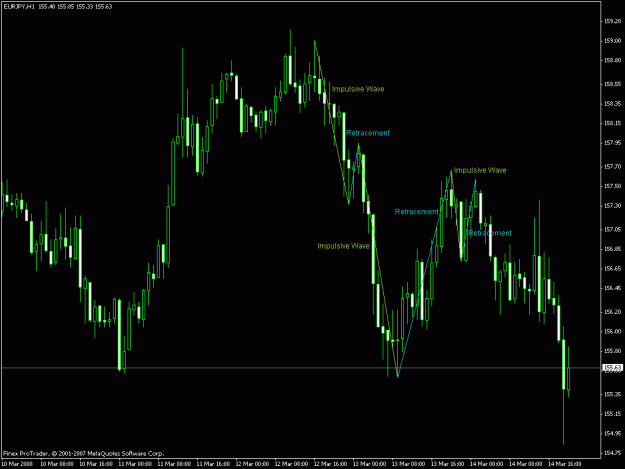
{chart 1}
Long
Generally, you are buying in an uptrend, when the AB impulse wave retraces to the 61.8 or 78.6 level. Before pinpointing a precise entry, you wait for the next candle (confirmation candle) to form. This must not exceed the low made by the retracement and has to be a bullish reversal candle (ie, Harami, Doji, Bullish Maribozu, Bullish Belt hold, etc).
At the precise entry point:
1) The new candle following the Confirmation Candle is on or near the 5 SMA.
2) On the Stochastic Oscillator window, the fast stoch (blue line) has already crossed or is crossing the slow stoch (red dotted line) and hooking up. This cross should not happen in the overbought region (80 or above).
Short
Generally, you are selling in a downtrend, when the AB impulse wave retraces to the 61.8 or 78.6 level. Before pinpointing a precise entry, you wait for the next candle (confirmation candle) to form. This must not exceed the high made by the retracement and has to be a bearish reversal candle (ie, Harami, Doji, Bearish Maribozu, Bearish Belt hold, etc).
At the precise entry point:
1) The new candle following the Confirmation Candle is on or near the 5 SMA.
2) On the Stochastic Oscillator window, the fast stoch (blue line) has already crossed or is crossing the slow stoch (red dotted line) and hooking down. This cross should not happen in the oversold region (20 or below).
INVALID SETUPS
A setup is considered invalid:
1) If there is a news release within 15-30mins.
2) If the confirmation candle moves so much that the stop loss is widened to a point where the Risk/Reward ratio is no longer 1:1.5.
3) If there is a major psychological support/resistance (ie, 2.0000 for Cable, 1.5000 for EURUSD, etc) before the first profit level (Target 1).
4) If the setup is against the major trend (atleast two TFs up from the one you are trading with).
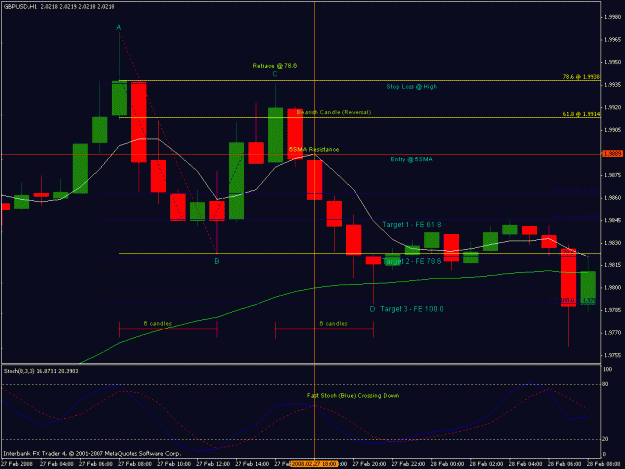
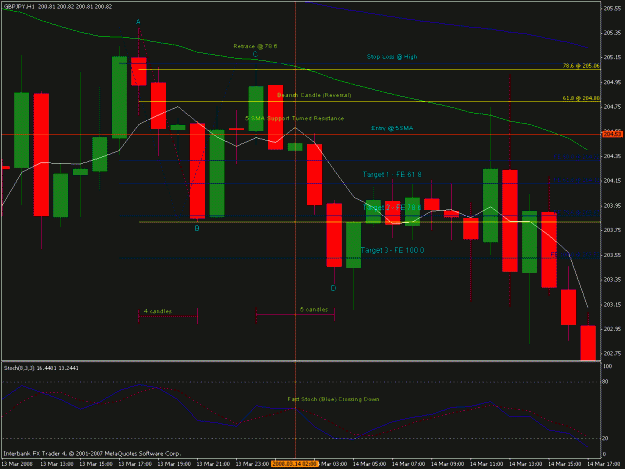
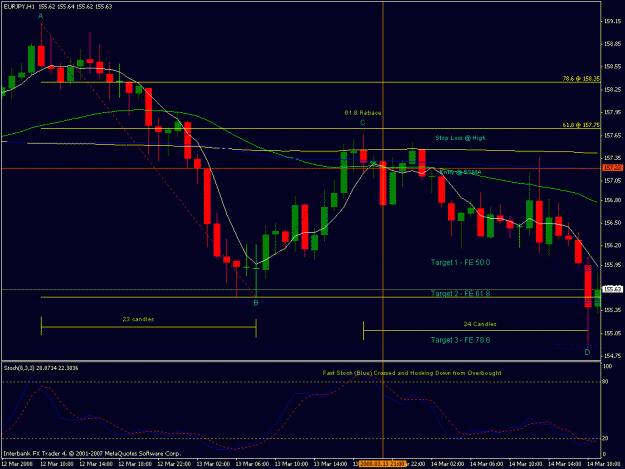
STOP LOSS
Stop Loss should be placed where the first impulse wave starts (Point C on the charts). Only take a trade if the stop loss is smaller than your
projected Target 2.
ENTRY STRATEGY
Here is an example, using a $10,000 account at 1:100 leverage.
I am only willing to risk 1% of my account and assume the stop loss has already been establish (start of the first impulse wave) and is 30pips + 3pips spread.
(10,000*0.01) / 33 = 3
So, I can trade at $3/pip, meaning I can go into the trade with 3 mini lots. There are three profit taking levels, so I should divide the lots into three equal lots and enter all of them at the same price (entry point). In this case, I have 3 x 1mini lots to enter at the same price and I will exit each mini lot at the different target levels, if they are not stopped out first.
EXIT STRATEGY
Carrying on from the previous example, I would exit my first lot at Target 1. If price does reach Target 2, I will take out the second lot, and move my stop loss to Break Even (Entry point). I will then take out my last lot when Target 3 is reached.
If you look at the charts provided, you can see that the targets can be calculated using the Fibonacci Expansion tool.
-When the confirmation candle is a Harami (Inside bar), use FE 50.0 as Target 1, FE 61.8 as Target 2 and FE 78.6 as Target 3.
-When the 'AB' wave consists of more than 10 candles, use FE 50.0 as Target 1, FE 61.8 as Target 2 and FE 78.6 as Target 3.
-When the confirmation candle is quite large, use FE 61.8 as Target 1, FE 78.6 as Target 2 and FE 100.0 as Target 3.
Illustration
Please take a look at the following charts for examples of Short and Long trades that I took recently. I will add more upon request.
I hope I haven’t bored you with this lengthy post, if I have, then do apologise. I am looking forward to your feedbacks; let that be positive or negative.
Thanks.
First off, I am a full-time trader and I have been trading in the currency market for more than four years now. As a long time lurker of this forum, I finally feel the need to participate in forums, as day-trading has gotten pretty boring. I have three very powerful strategies in my trading arsenal, and what better way to start than to share one of the strategies here. I wouldn’t call this an entirely mechanical system, as you need to use some discretion. I will be outlining some of the important factors that may need consideration before entering a trade based on this system, later in this post.
I call this system: A.M.G Waves
Timeframe: Any. But, I use 1Hr or higher to avoid whipsaws.
Pair: Any Currency Pair.
Indicator(s):
Stochastic Oscillator (8,3,3)
5 SMA
Before I give out the entry requirements, please take a look at the following picture. A setup only exists where the fib retracement of an impulse wave is 61.8 or 78.6. The idea behind this method is that provided AB wave retraces by 61.8% or 78.6%, it should equal the CD wave. Only look for setups that are in the direction of the bigger trend (ie: If you are looking at setups on the hourly, then only look for signals that are with the daily trend).
Attached Image (click to enlarge)
{chart 1}
Long
Generally, you are buying in an uptrend, when the AB impulse wave retraces to the 61.8 or 78.6 level. Before pinpointing a precise entry, you wait for the next candle (confirmation candle) to form. This must not exceed the low made by the retracement and has to be a bullish reversal candle (ie, Harami, Doji, Bullish Maribozu, Bullish Belt hold, etc).
At the precise entry point:
1) The new candle following the Confirmation Candle is on or near the 5 SMA.
2) On the Stochastic Oscillator window, the fast stoch (blue line) has already crossed or is crossing the slow stoch (red dotted line) and hooking up. This cross should not happen in the overbought region (80 or above).
Short
Generally, you are selling in a downtrend, when the AB impulse wave retraces to the 61.8 or 78.6 level. Before pinpointing a precise entry, you wait for the next candle (confirmation candle) to form. This must not exceed the high made by the retracement and has to be a bearish reversal candle (ie, Harami, Doji, Bearish Maribozu, Bearish Belt hold, etc).
At the precise entry point:
1) The new candle following the Confirmation Candle is on or near the 5 SMA.
2) On the Stochastic Oscillator window, the fast stoch (blue line) has already crossed or is crossing the slow stoch (red dotted line) and hooking down. This cross should not happen in the oversold region (20 or below).
INVALID SETUPS
A setup is considered invalid:
1) If there is a news release within 15-30mins.
2) If the confirmation candle moves so much that the stop loss is widened to a point where the Risk/Reward ratio is no longer 1:1.5.
3) If there is a major psychological support/resistance (ie, 2.0000 for Cable, 1.5000 for EURUSD, etc) before the first profit level (Target 1).
4) If the setup is against the major trend (atleast two TFs up from the one you are trading with).
STOP LOSS
Stop Loss should be placed where the first impulse wave starts (Point C on the charts). Only take a trade if the stop loss is smaller than your
projected Target 2.
ENTRY STRATEGY
Here is an example, using a $10,000 account at 1:100 leverage.
I am only willing to risk 1% of my account and assume the stop loss has already been establish (start of the first impulse wave) and is 30pips + 3pips spread.
(10,000*0.01) / 33 = 3
So, I can trade at $3/pip, meaning I can go into the trade with 3 mini lots. There are three profit taking levels, so I should divide the lots into three equal lots and enter all of them at the same price (entry point). In this case, I have 3 x 1mini lots to enter at the same price and I will exit each mini lot at the different target levels, if they are not stopped out first.
EXIT STRATEGY
Carrying on from the previous example, I would exit my first lot at Target 1. If price does reach Target 2, I will take out the second lot, and move my stop loss to Break Even (Entry point). I will then take out my last lot when Target 3 is reached.
If you look at the charts provided, you can see that the targets can be calculated using the Fibonacci Expansion tool.
-When the confirmation candle is a Harami (Inside bar), use FE 50.0 as Target 1, FE 61.8 as Target 2 and FE 78.6 as Target 3.
-When the 'AB' wave consists of more than 10 candles, use FE 50.0 as Target 1, FE 61.8 as Target 2 and FE 78.6 as Target 3.
-When the confirmation candle is quite large, use FE 61.8 as Target 1, FE 78.6 as Target 2 and FE 100.0 as Target 3.
Illustration
Please take a look at the following charts for examples of Short and Long trades that I took recently. I will add more upon request.
Attached Image (click to enlarge)
Attached Image (click to enlarge)
Attached Image (click to enlarge)
Attached Image (click to enlarge)
I hope I haven’t bored you with this lengthy post, if I have, then do apologise. I am looking forward to your feedbacks; let that be positive or negative.
Thanks.