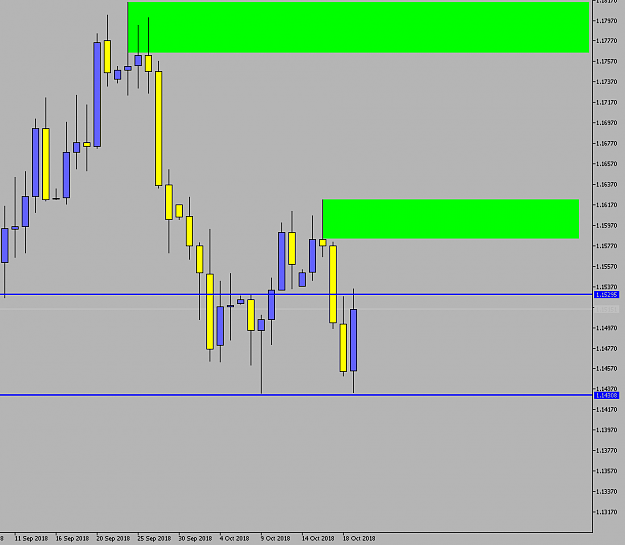
Inverse head and shoulders can predict a longer term trend reversal, true.
Targets up to 1.20xx have been confirmed by other sources, sentiment is switching long, don't know about instituational postitions (not going to bother).
I'm seeing an ABC EW pattern which we can easily switch to a flat correction if it doens't play out this way, in this case (B) will be A and so on.
So this doesn't tell us anything.
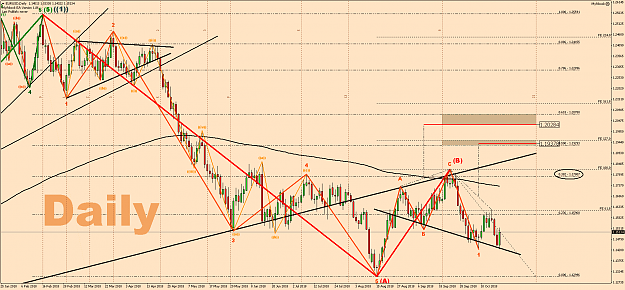
For now the long side has preference because of the impulse on friday that created a double bottom and an engulfing candle on the daily.
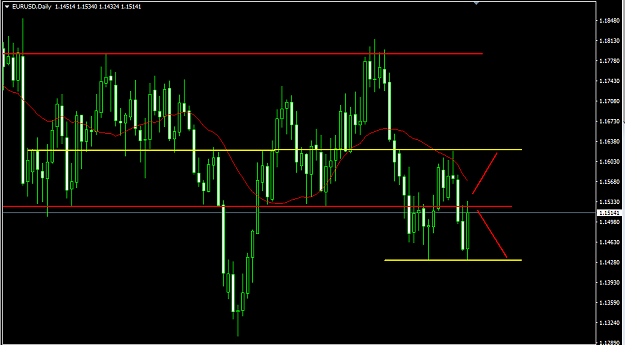
If it switches down however I too see a h&s pattern on the shorter uptrend and an AB=CD will give a target @ 1.1239x.
The only thing I know is that: 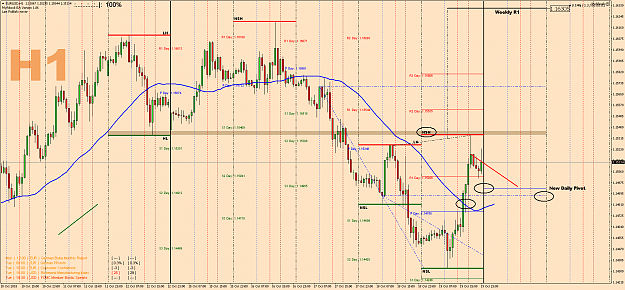
Grtz
Targets up to 1.20xx have been confirmed by other sources, sentiment is switching long, don't know about instituational postitions (not going to bother).
I'm seeing an ABC EW pattern which we can easily switch to a flat correction if it doens't play out this way, in this case (B) will be A and so on.
So this doesn't tell us anything.
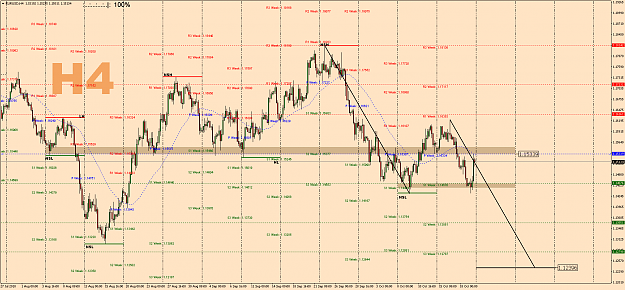
Attached Image (click to enlarge)
For now the long side has preference because of the impulse on friday that created a double bottom and an engulfing candle on the daily.
If it switches down however I too see a h&s pattern on the shorter uptrend and an AB=CD will give a target @ 1.1239x.
Attached Image (click to enlarge)
The only thing I know is that:
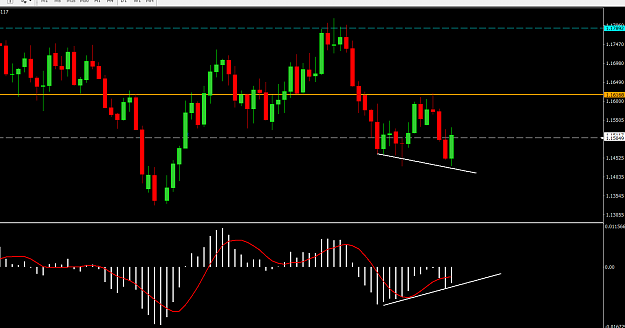
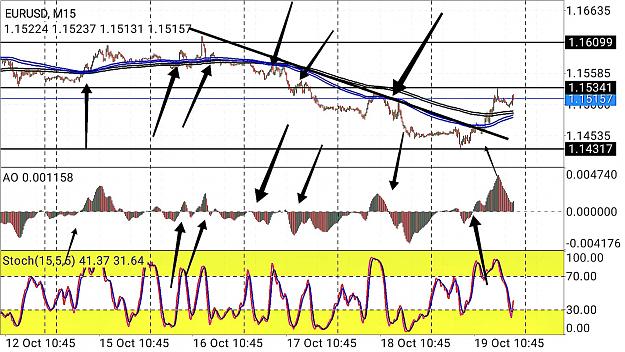
- Above this Blue line I keep buying
- Daily pivot is switching up which indicates buying
- A weak NSH is formed, which indicates buying
- Above previous LO price, again buying
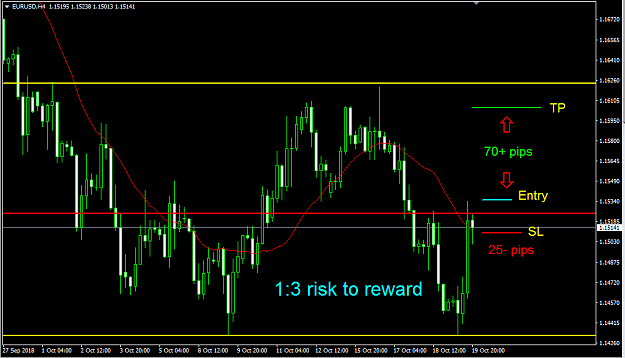
As for targets 1.1630x is a good first target since it adds up with previous weekly R1.
Beware of the previous weekly pivot which lines up with a resistance zone @ 1.1535x.
Oh, when price moves below the blue line I'll start selling ![]()
Attached Image (click to enlarge)
Grtz
What's that smell? ---- I smell money!
4