DislikedI pretty much disagree with the way you draw your trendlines, I find them to be fairly arbitrary, but then again, I wrote a book about it so I'm a critic of everybody (including myself).
I'm curious how you "draw" yours though, since I see lines drawn arbitrarily but then again, I'm nearsighted and blind as a bat so I might not be seeing the reasoning behind your lines..
So I'm curious why you pick certain points to use and not others, and why you don't pick the tops of some lines..Ignored
Edit: I assume/hope this was meant for me since I answered with so damn much haha, even tho other people answered (I noticed after I wrote) ?
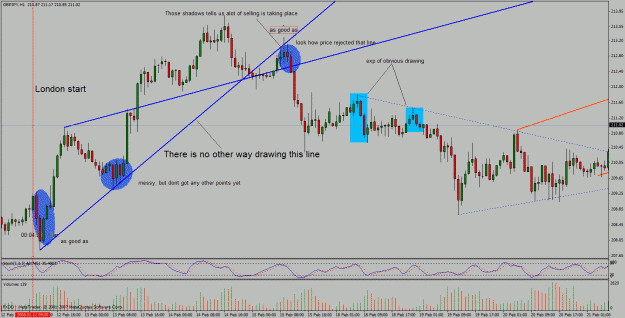
I'm not sure if you have read the introduction of this thread since you call the drawing arbitrary ? Might be me explaining poorly.
Anyway, I could put it out again;
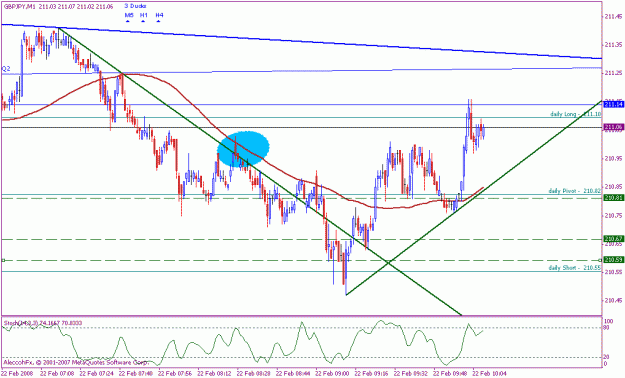
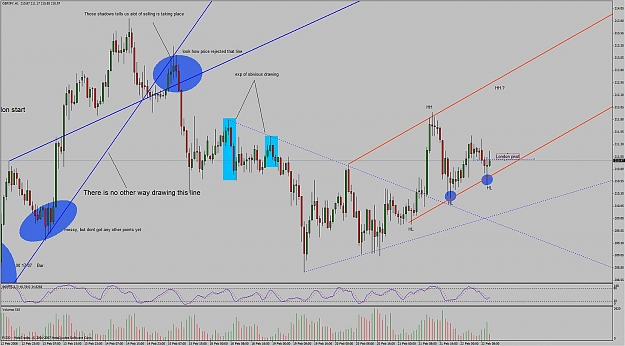
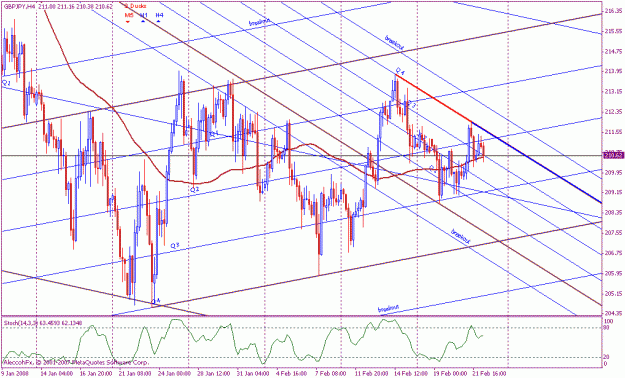
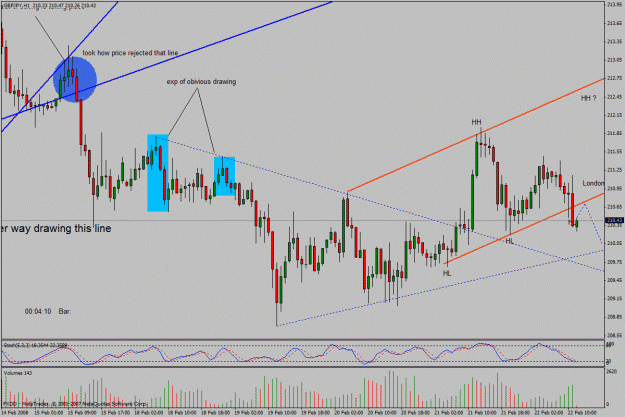
I use candlestick pattern; we are in a uptrend, 2 green bars followed by inverted hammer and 2 red bars, which is perfect candlestick for where price stops/reverses, quick change of supply/demand, and the ultimate setup I try to look for drawing my lines. If I don't see hammer-setup I tend to draw from 2 red bars followed by 2 green. But there must be some kind of shadow on the candlestick to show that price struggles at currently level.
But mostly on a chart there is only 1 way to draw lines as posted on the chart. Mostly, not always, and it seemed to me that some newcomers could use some way of drawing they're lines.
I'm not saying this is the only way drawing, or the most correctly way of drawing, it's simply a way working for me. I'm sure you got other ways of drawing that could turn out almost (better?) same way.
This was not meant as a trading-system, although is might start forming that way.
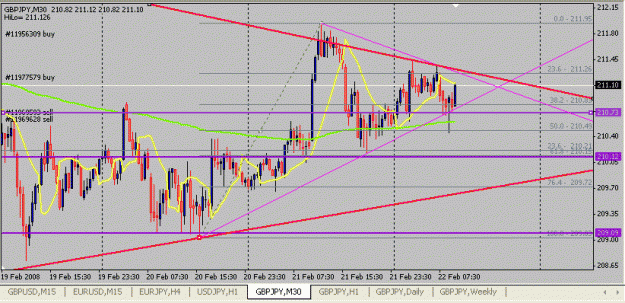
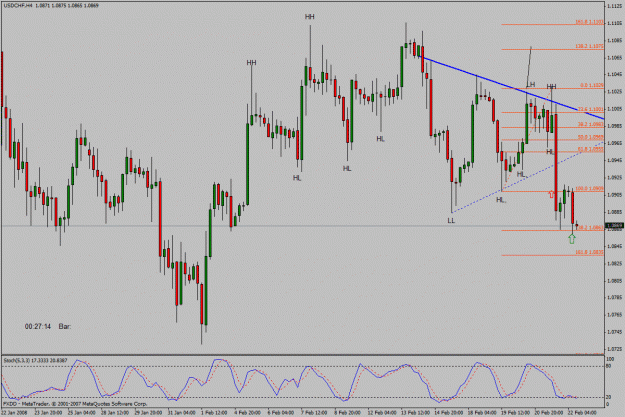
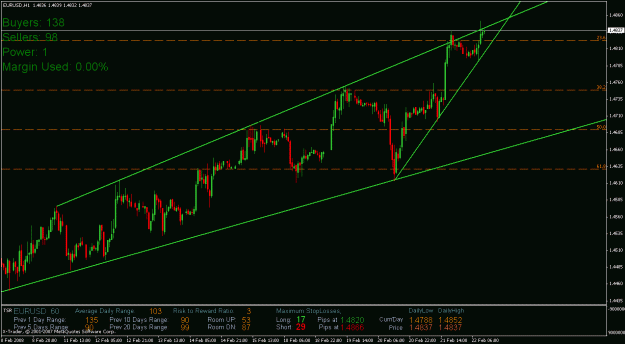
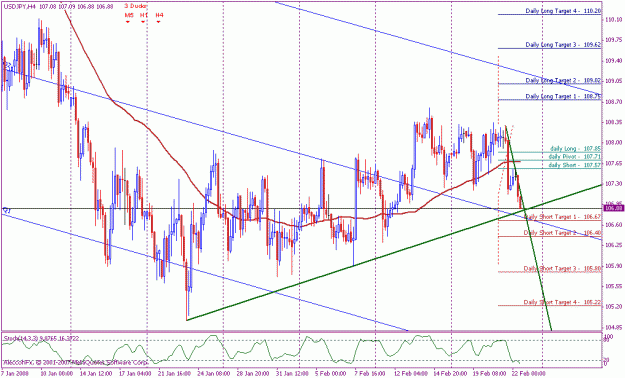
Attached Image (click to enlarge)
Measure twice, cut once