{quote} I closed them both at 36 and 37. Done. Back testing over the weekend hopefully leaves me with 4 other pairs that give 2-3 net wins a month
Ignored
UJ 34 wins and 20 Losses, 14 Net Wins from February - September, again not taking into consideration news or moving SL
EU 34 wins and 16 Losses, 18 net wins from January - September
Total for the two at 68 Wins and 35L = 32 Wins over 9 months... thats 3.5 Wins/month on average for these two pairs. not including news it would probably be higher, but for the sake of back testing ill include them. average 2 net wins/month/pair, i trade 6 pairs, thats 12 net wins on average = 24% per month... there is room for improvement. EU's bad months January 5W 5L; March 2W 3L; June 4W 4L; August 2W 2L. UJ's bad months February 1W 2L; April 3W 3L; May 5W 6L; August 3W 3L
ill go over these and compare with the good months, see what the deal is.
{quote} UJ 34 wins and 20 Losses, 14 Net Wins from February - September, again not taking into consideration news or moving SL EU 34 wins and 16 Losses, 18 net wins from January - September Total for the two at 68 Wins and 35L = 32 Wins over 9 months... thats 3.5 Wins/month on average for these two pairs. not including news it would probably be higher, but for the sake of back testing ill include them. average 2 net wins/month/pair, i trade 6 pairs, thats 12 net wins on average = 24% per month... there is room for improvement. EU's bad months January...
Ignored
UCAD gives more losses than wins, unless i can find a filter for the losses on EU and UJ, UCAD i wont trade, it has too much to do with Oil, un-announced OPEC cuts etc etc
{quote} UCAD gives more losses than wins, unless i can find a filter for the losses on EU and UJ, UCAD i wont trade, it has too much to do with Oil, un-announced OPEC cuts etc etc
Ignored
GU tested, 26 Wins, 14 loss, 12 net wins over 6 months, 2 wins per month exact.
Edit: ive come accross a problem, my MP includes the gap when NY closes and Sydney opens... that can give different levels
{quote} GU tested, 26 Wins, 14 loss, 12 net wins over 6 months, 2 wins per month exact. Edit: ive come accross a problem, my MP includes the gap when NY closes and Sydney opens... that can give different levels
Ignored
there are still too many losses/month/pair
as soon as the consistency increases i can increase my Risk %
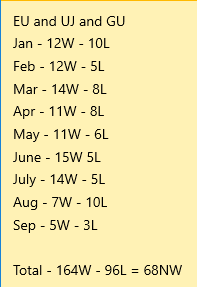
January gave 12 wins and 10 losses for EU GU and UJ, thats net 2 wins and 4% return for the month, it needs another 4 net wins, each month per pair has to have at least 6 net wins before i can increase the risk, once i see it over 6 months i will slowly increase the risk to a max of 5%
{quote} there are still too many losses/month/pair as soon as the consistency increases i can increase my Risk % January gave 12 wins and 10 losses for EU GU and UJ, thats net 2 wins and 4% return for the month, it needs another 4 net wins, each month per pair has to have at least 6 net wins before i can increase the risk, once i see it over 6 months i will slowly increase the risk to a max of 5% per pair needs 2 net wins per month every month
Ignored
Adding GU EU and UJ together over the year so far gives 164 Wins - 96 Losses = 68 Net wins = 7.5 Wins / month
So clearly August is the worst month, April isn't great but its positive, and likewise with January.
ill go over August PA and see whats the crack
August was the worst performer over the three pairs but Gu was the worst with 3 Net losses, the other 2 were equal
{quote} Adding GU EU and UJ together over the year so far gives 164 Wins - 96 Losses = 68 Net wins = 7.5 Wins / month So clearly August is the worst month, April isn't great but its positive, and likewise with January. ill go over August PA and see whats the crack August was the worst performer over the three pairs but Gu was the worst with 3 Net losses, the other 2 were equal {image}
Ignored
here are 3 notable losses on GU in august... the PA is zig zag all day, the entry levels are pretty central to all the cop zone, so the volumes are probably rinsed all day or during the day... the days are more 'D' shape days, so ill go back over the pairs without any indicator and select days that are similar to this and test them out.
after i will select all 'D'shape days regardless of the PA and remove them, and check the results
Its hard to distinguish the days, ill have to go back and check the every day again, see where my entry levels are, and if they are in the middle of the chop, then give them the chop...
as a quick scan, GU got rid of 5 losses and 2 wins by doing a quick chop check...
{quote} Adding GU EU and UJ together over the year so far gives 164 Wins - 96 Losses = 68 Net wins = 7.5 Wins / month So clearly August is the worst month, April isn't great but its positive, and likewise with January. ill go over August PA and see whats the crack August was the worst performer over the three pairs but Gu was the worst with 3 Net losses, the other 2 were equal {image}
{quote} hey, will you add an explorer in the fututre ?
Ignored
i had one, but i moved to Ctrader and that isnt compatible with Forex Factory, ive tried to make a MyFxbook but its not working, still says history is missing
EU gives some good results fewer trades and much fewer losses, max of 2 losses this year. 17 NW in total, im happy to increase the risk if that is the case.
however its the other pairs, AU GU and UCAD UJ hardly any trades. ill test EJ. only thing i haven't tested is previous days, trading levels left on earlier days rather than just the previous day.
EU gives some good results fewer trades and much fewer losses, max of 2 losses this year. 17 NW in total, im happy to increase the risk if that is the case. however its the other pairs, AU GU and UCAD UJ hardly any trades. ill test EJ. only thing i haven't tested is previous days, trading levels left on earlier days rather than just the previous day. it needs more wins still.
Ignored
perhaps an over-complication here, i trade 8 pairs with this method, although still in testing, 1.5 net wins/pair is all i need for a decent monthly return. that's not hard
im really reluctant to post my analysis here, if someone knows my levels, someone knows my stops... im skeptical. Rothschild, Rockefella, Barclays CEO... FUCKING COME AT ME
im really reluctant to post my analysis here, if someone knows my levels, someone knows my stops... im skeptical. Rothschild, Rockefella, Barclays CEO... FUCKING COME AT ME
Ignored
here is my analysis for one of my recent wins on EU, sellers clearly gathered in pressure in the white box after some consolidation... we had already seen some rejection higher up to get into this level, so those sellers + more sellers must be around that zone to defend their level, and hence a nice reaction from ther
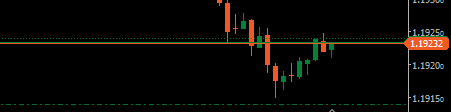
two quick wins during Asia, UJ +10, EJ +10 {image} {image}
Ignored
SNAP, i just realised that i cancelled all orders on AU because i thought there was news out last night rather than tonight asia, oops. had a pending sell 0.8025, damn
HMHMHM, AU NU and EU could all get a trigger at the same time, that would not be convenient