Disclaimer: Posts are educational commentary only, and are not intended to give investment advise. Trade at your own risk and analysis. Please read full disclaimer here.
Trading Journal: Week of April 3rd - 7th, 2017
USDTHB - The US Dollar has been on a steep decline since January relative to the Thai Baht. It made a retracement back in the end of February and continued to decline on a weekly basis since then. It currently trades below its Moving Averages and is extended from the 10-period Weekly Moving Average by 182% relative to its ATR.

On the Daily chart, the pair is being monitored for Reversal Trade opportunities to the Long side. It currently displays a Doji candle which may pave the way for a reversal to the 38.2% Fibonacci Retracement level, however, descending Simple Moving Averages on the Daily chart may hinder its climb. Given the nature of price relative to the SMAs, a position will not be taken at this time, but the Currency Pairs outcome will be closely monitored.

USDHKD - The US Dollar typically trades in a rangebound manner relative to the Hong Kong Dollar. Since the beginning of February of the current year, the Greenback has risen sharply and is currently priced way above its Weekly Moving Averages. Specifically, this Currency Pair extends from its 10-period Weekly Moving Average by 159% relative to the Average True Range.
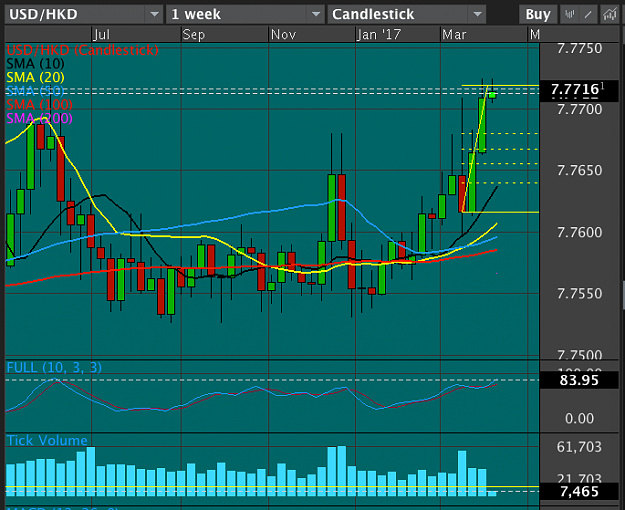
On the Daily chart, the Greenback is also priced above its symmetrically rising Simple Moving Averages, which evidence the strength behind the current trend. Given the length of its current uptrend and the Oversold condition evidenced by its Stochastic Indicator, reversal opportunities will be prospected to the downside. As investors seek to take profits from the observed rise in price, high probability trading opportunities will be pursued with the 38.2% Fibonacci Resistance Level as profit target.

USDMXN - Similar to other USD currency pairs, the Greenback finds itself trading at Oversold levels against the Mexican Peso. Following last weeks analysis a Long Position was taken at the close of the March 30th candle, which exhibited a Doji-like formation. Profit target is placed at 18.9907, the 38.2% Fibonacci Retracement Level. This trade is a counter-trend Reversal Trade seeking to profit from Retracement patterns on the Weekly Chart.

Trading Journal: Week of April 3rd - 7th, 2017
USDTHB - The US Dollar has been on a steep decline since January relative to the Thai Baht. It made a retracement back in the end of February and continued to decline on a weekly basis since then. It currently trades below its Moving Averages and is extended from the 10-period Weekly Moving Average by 182% relative to its ATR.
Attached Image (click to enlarge)
On the Daily chart, the pair is being monitored for Reversal Trade opportunities to the Long side. It currently displays a Doji candle which may pave the way for a reversal to the 38.2% Fibonacci Retracement level, however, descending Simple Moving Averages on the Daily chart may hinder its climb. Given the nature of price relative to the SMAs, a position will not be taken at this time, but the Currency Pairs outcome will be closely monitored.
Attached Image (click to enlarge)
USDHKD - The US Dollar typically trades in a rangebound manner relative to the Hong Kong Dollar. Since the beginning of February of the current year, the Greenback has risen sharply and is currently priced way above its Weekly Moving Averages. Specifically, this Currency Pair extends from its 10-period Weekly Moving Average by 159% relative to the Average True Range.
Attached Image (click to enlarge)
On the Daily chart, the Greenback is also priced above its symmetrically rising Simple Moving Averages, which evidence the strength behind the current trend. Given the length of its current uptrend and the Oversold condition evidenced by its Stochastic Indicator, reversal opportunities will be prospected to the downside. As investors seek to take profits from the observed rise in price, high probability trading opportunities will be pursued with the 38.2% Fibonacci Resistance Level as profit target.
Attached Image (click to enlarge)
USDMXN - Similar to other USD currency pairs, the Greenback finds itself trading at Oversold levels against the Mexican Peso. Following last weeks analysis a Long Position was taken at the close of the March 30th candle, which exhibited a Doji-like formation. Profit target is placed at 18.9907, the 38.2% Fibonacci Retracement Level. This trade is a counter-trend Reversal Trade seeking to profit from Retracement patterns on the Weekly Chart.
Attached Image (click to enlarge)