• Home
  • Forums
  • Trades
  • News
  • Calendar
  • Market
  • Brokers
  • Login
  • Join
  • User/Email: Password:
  • 8:41pm
Menu
  • Forums
  • Trades
  • News
  • Calendar
  • Market
  • Brokers
  • Login
  • Join
  • 8:41pm
Sister Sites
  • Metals Mine
  • Energy EXCH
  • Crypto Craft

Options

Bookmark Thread

First Page First Unread Last Page Last Post

Print Thread

Similar Threads

Rainbow similarity 256 replies

Similarity Trading - The ZZBB Method 213 replies

Similarity: A Practical Approach 858 replies

Similarity Stuff 17 replies

Directional Similarity 0 replies

  • Trading Discussion
  • /
  • Reply to Thread
  • Subscribe
  • 7
Attachments: Similarity Present Day
Exit Attachments

Similarity Present Day

  • Last Post
  •  
  • Page 1 2
  • Page 1 2
  •  
  • Post #1
  • Quote
  • First Post: Jan 22, 2017 3:28pm Jan 22, 2017 3:28pm
  •  acetrader
  • Joined Feb 2006 | Status: Member | 1,674 Posts
Although not trying to reopen old wounds from this thread, I would like to know are there any traders
using any parts of the Similarity thread. What I am most interested in are you using Similarity as
stated using Bollinger Bands, Stochastic & Zig Zags. If so would you share you settings & any success
& failure you experienced. Not wanting to nose into your method, but just your views & info your willing
to share is appreciated.

I do have a motive behind this request. I read the thread two times & did extract several gems to add to
my current trading method & want to see if anyone else did the same. Those extracted gems are NOT the core
of my current method, but used alone they have merit. For me the negative to Similarity is all the lines from
the indicators you have on the chart, but those lines have merit if you use them correctly. Just that I like
clean charts for the most part. It took me two weeks of reading & rereading along with note taking, but those
gems can be found. There are two currency pairs that I trade my version of Similarity on & that info can be found
if you look. That version is what I put together. It is NO Holy Grail of Trading, but has merits. You decide.

To the NEW Traders coming onboard this ship of trading there is one method posted on this forum that it would
certainly behoove you to find & immerse yourself into its contents. NO, NOT going to tell you the name. The
Trader who started this thread is well known & his info is solid if the rules are followed. Being TooSlOW & taking
your time to learn to trade can be a good thing. This was off topic, but just had to share. Seek & ye shall find.
BTW: New Trader you have been given a clue on the thread I am speaking of. Its in the body of this thread.

All that are willing to share in reference to the Similarity thread thank you.

_____________________________
  • Post #2
  • Quote
  • Edited at 12:19pm Jan 23, 2017 12:07pm | Edited at 12:19pm
  •  arya.aryaee
  • | Joined Oct 2012 | Status: Member | 324 Posts
Quoting acetrader
Disliked
Although not trying to reopen old wounds from this thread, I would like to know are there any traders using any parts of the Similarity thread. What I am most interested in are you using Similarity as stated using Bollinger Bands, Stochastic & Zig Zags. If so would you share you settings & any success & failure you experienced. Not wanting to nose into your method, but just your views & info your willing to share is appreciated. I do have a motive behind this request. I read the thread two times & did extract several gems to add to my current trading...
Ignored
hi acetrader
thankyou to prepare this fortune for exchanging the experiences of similarity method.
i was trading in some while by simlarity rule between stoch and zigzag . stoch setting was (13,1,1),(21,1,1),(34,1,1),(55,1,1) level 98,2.....and zigzag14,22,35,56..
also i remember i checked similarity between cci and zz ..and it was also interesting experience.
 
 
  • Post #3
  • Quote
  • Jan 23, 2017 3:40pm Jan 23, 2017 3:40pm
  •  metta87
  • | Joined Jul 2012 | Status: Member | 1,159 Posts
So are you a profitable trader now, or does it just help you to make more sense out of the market ?
 
 
  • Post #4
  • Quote
  • Jan 23, 2017 5:12pm Jan 23, 2017 5:12pm
  •  acetrader
  • Joined Feb 2006 | Status: Member | 1,674 Posts
Quoting arya.aryaee
Disliked
{quote} hi acetrader thankyou to prepare this fortune for exchanging the experiences of similarity method. i was trading in some while by simlarity rule between stoch and zigzag . stoch setting was (13,1,1),(21,1,1),(34,1,1),(55,1,1) level 98,2.....and zigzag14,22,35,56.. also i remember i checked similarity between cci and zz ..and it was also interesting experience.
Ignored
arya.aryaee Give these a look. Bollinger Band 24, 0, 2 On Close. EMA 1 On Close.
Stochastic 100,1,1 EMA On Close. Stochastic 300,1,1 EMA On Close. NO ZIG ZAG USED.

These are the settings I have, but not trading this method as a stand alone. Used as
confirmation. Take a look at what happens when all indicators are in agreement (Similarity).
Sometimes it take awhile for price to turn after all indicators lineup. Use at your own
peril. Hope this helps.

___________________
 
 
  • Post #5
  • Quote
  • Jan 24, 2017 6:56am Jan 24, 2017 6:56am
  •  arya.aryaee
  • | Joined Oct 2012 | Status: Member | 324 Posts
Quoting acetrader
Disliked
{quote} arya.aryaee Give these a look. Bollinger Band 24, 0, 2 On Close. EMA 1 On Close. Stochastic 100,1,1 EMA On Close. Stochastic 300,1,1 EMA On Close. NO ZIG ZAG USED. These are the settings I have, but not trading this method as a stand alone. Used as confirmation. Take a look at what happens when all indicators are in agreement (Similarity). Sometimes it take awhile for price to turn after all indicators lineup. Use at your own peril. Hope this helps. ___________________
Ignored
Thankyou acetrader for sharing ! do you use also BB24 on stoch300 window?
Attached File
File Type: ex4 StochBB.ex4   6 KB | 97 downloads
 
 
  • Post #6
  • Quote
  • Jan 24, 2017 6:59am Jan 24, 2017 6:59am
  •  arya.aryaee
  • | Joined Oct 2012 | Status: Member | 324 Posts
i also some while was trying on this indi based on dissimilarity not similarity!
Attached Files
File Type: ex4 StochZZmismatch v2.ex4   10 KB | 104 downloads
File Type: mq4 StochDifZones_v2_60_v600.mq4   25 KB | 103 downloads
 
 
  • Post #7
  • Quote
  • Jan 24, 2017 7:30am Jan 24, 2017 7:30am
  •  metta87
  • | Joined Jul 2012 | Status: Member | 1,159 Posts
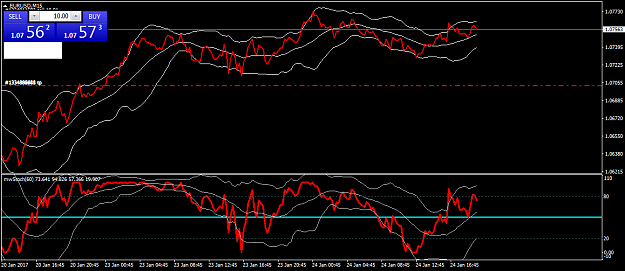
what do you mean by all indicators in agreement ...
Attached Image (click to enlarge)
Click to Enlarge

Name: bbstoch.png
Size: 128 KB
 
 
  • Post #8
  • Quote
  • Jan 24, 2017 9:51am Jan 24, 2017 9:51am
  •  acetrader
  • Joined Feb 2006 | Status: Member | 1,674 Posts
Quoting arya.aryaee
Disliked
{quote} Thankyou acetrader for sharing ! do you use also BB24 on stoch300 window? {file}
Ignored
In the chart window use Bollinger Bands & the EMA1 at CLOSE as I described.

Then at the chart bottom in a separate window load the Stochastic 300, 1 ,1 at CLOSE

Then at the chart bottom in a separate window load another Stochastic 100,1,1 at CLOSE.

You can even load the RSI 8.

When the candles & the EMA1 are outside of the Bollinger Band either at the top or bottom see what
signals the Stochastics & RSI are giving you. Make sure the two Stochastic are in separate
window. I do not use the second Bollinger Band at the chart bottom. Only the one around the candles.
NO ZIG ZAG is used.


Only looking for Similarity of all indicator & then trade it.
 
 
  • Post #9
  • Quote
  • Jan 24, 2017 9:57am Jan 24, 2017 9:57am
  •  acetrader
  • Joined Feb 2006 | Status: Member | 1,674 Posts
Quoting arya.aryaee
Disliked
{quote} Thankyou acetrader for sharing ! do you use also BB24 on stoch300 window? {file}
Ignored
When you see Similarity the change in trend will not be immediately most of the time, so
don't expect a quick turn once you see Similarity of the indicators. Observe before you act.
This is not a 100 accurate method, but none are.

This is NOT my core method of trading, but I do pay attention to the signals.

I hope this helps. Best of trades to you.

___________________________
 
 
  • Post #10
  • Quote
  • Jan 24, 2017 11:08am Jan 24, 2017 11:08am
  •  acetrader
  • Joined Feb 2006 | Status: Member | 1,674 Posts
arya & metta,

One other thing that I forgot. Time frame I use is the 15M or 30M.
The signals your looking for are for all of the indicators to line up
showing either a BUY /SELL. If you use the RSI 8 you will have 5 signals
to observe. If all 5 line UP (show the same signal) that's the best. If
4 line UP the signal still has merit. Its UP TO YOU to decide.

Put this indicators on the pairs you trade & pay attention to what you see.

Again, THIS IS NOT A 100% ACCURATE METHOD, BUT MAKE OF IT WHAT YOU WILL.

EURUSDD the starter of the Similarity thread shared some nuggets of usefulness
it his thread, although I think some were buried deep in what he share if you
can decode them. Not very satisfied with all the clutter on the chart that
this version of Similarity causes, but the method appears to have merit.

I would appreciate you guys sharing your results along the way should you decide to
try this. REMEMBER TRADE THIS AT YOUR OWN RISK.

BEST OF TRADES TO YOU.
___________________________
 
 
  • Post #11
  • Quote
  • Edited at 12:53pm Jan 24, 2017 12:33pm | Edited at 12:53pm
  •  arya.aryaee
  • | Joined Oct 2012 | Status: Member | 324 Posts
[quote=acetrader;9474292]arya & metta, One other thing that I forgot. Time frame I use is the 15M or 30M. The signals your looking for are for all of the indicators to line up showing either a BUY /SELL. If you use the RSI 8 you will have 5 signals to observe. If all 5 line UP (show the same signal) that's the best. If 4 line UP the signal still has merit. Its UP TO YOU to decide. Put this indicators on the pairs you trade & pay attention to what you see. Again, THIS IS NOT A 100% ACCURATE METHOD, BUT MAKE OF IT WHAT YOU WILL. EURUSDD the starter of the Similarity thread shared some nuggets of usefulness it his thread, although I think some were buried deep in what he share if you can decode them. Not very satisfied with all the clutter on the chart that this version of Similarity causes, but the method appears to have merit. I would appreciate you guys sharing your results along the way should you decide to try this. REMEMBER TRADE THIS AT YOUR OWN RISK. BEST OF TRADES TO YOU. ___________________________
[/quotThankyou acetrader!
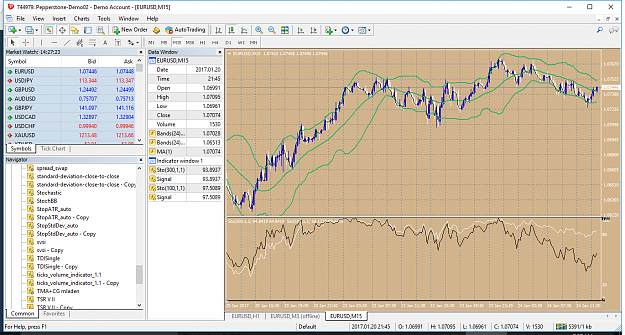
but as i understood from EURUSDD threat we must find out similarities of EMA1 and his bb with STOCH300 and his bb of it. (95%).or we could looking for dissimilarity of them (5%)
Attached Image (click to enlarge)
Click to Enlarge

Name: EURUSDM15.png
Size: 38 KB
 
 
  • Post #12
  • Quote
  • Jan 24, 2017 1:06pm Jan 24, 2017 1:06pm
  •  acetrader
  • Joined Feb 2006 | Status: Member | 1,674 Posts
ary.aryaee I'm sorry I forgot to state that I have modified what EURUSDD shared & dropped the Bollinger Band
that he had at the chart bottom From what I see its not needed as you have three other indicators in its place.
You have it correct on the chart you posted & you can use it if you like. I didn't try it that way. Just
sharing what I put together. What you posted has Similarity. Try using what I share & see what you think.
What I'm looking for is another set, or several sets of other traders eyes looking at this to see if they see the
merit of using this. That is my MOTIVE for starting this thread.

Your views & the views of other is appreciated.
_____________________________
 
 
  • Post #13
  • Quote
  • Jan 24, 2017 1:09pm Jan 24, 2017 1:09pm
  •  arya.aryaee
  • | Joined Oct 2012 | Status: Member | 324 Posts
Quoting acetrader
Disliked
ary.aryaee I'm sorry I forgot to state that I have modified what EURUSDD shared & dropped the Bollinger Band that he had at the chart bottom From what I see its not needed as you have three other indicators in its place. You have it correct on the chart you posted & you can use it if you like. I didn't try it that way. Just sharing what I put together. What you posted has Similarity. Try using what I share & see what you think. What I'm looking for is another set, or several sets of other traders eyes looking at this to see if they see the merit...
Ignored
ok thanks. i will try yours
 
 
  • Post #14
  • Quote
  • Jan 24, 2017 1:18pm Jan 24, 2017 1:18pm
  •  arya.aryaee
  • | Joined Oct 2012 | Status: Member | 324 Posts
may i ask you to show a picture of chart when 5 signal are in a line up?
 
 
  • Post #15
  • Quote
  • Jan 24, 2017 4:33pm Jan 24, 2017 4:33pm
  •  acetrader
  • Joined Feb 2006 | Status: Member | 1,674 Posts
Quoting arya.aryaee
Disliked
may i ask you to show a picture of chart when 5 signal are in a line up?
Ignored
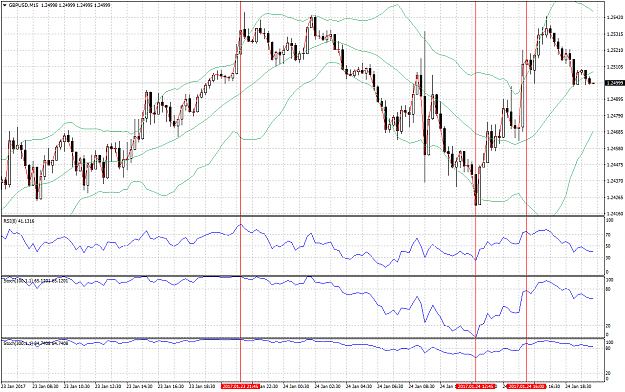
Take a look at this chart if it uploads.

Notice the first signal from the left side of chart price took off immediately. The second took off
off immediately & the third signal price was slow to turn. Now on each of these signals notice
where Stochastic 100 & 300 as well as RSI 8 where located. What signals were they giving?

Let me know what you think after you observe more charts using this one as
a guide. The more you look the more you will understand what these signals are telling you.
Look for all indicators to line up & you have SIMILARITY.

I hope this helps.

___________________________
Attached Image (click to enlarge)
Click to Enlarge

Name: GBPUSDM15.png
Size: 79 KB
 
 
  • Post #16
  • Quote
  • Jan 25, 2017 8:49am Jan 25, 2017 8:49am
  •  metta87
  • | Joined Jul 2012 | Status: Member | 1,159 Posts
Quoting acetrader
Disliked
{quote} Take a look at this chart if it uploads. Notice the first signal from the left side of chart price took off immediately. The second took off off immediately & the third signal price was slow to turn. Now on each of these signals notice where Stochastic 100 & 300 as well as RSI 8 where located. What signals were they giving? Let me know what you think after you observe more charts using this one as a guide. The more you look the more you will understand what these signals are telling you. Look for all indicators to line up & you have SIMILARITY....
Ignored
hey ace, iobserved a lot of charts yesterday and what i see i that when price reach extremes on both stochs (above 98-below 02 ) and the candle and ema1 are outside bollinger, a reversal is coming. when ? i dont know, it can come in the next candle, the second the third. How much does it reverse ? sometimes it reverses past the point where the signal was given, sometimes it reverses very little. so sl and tp could be tricky.

In your first signal to the left above, why would you enter there and not the candle prior to it since it also respects your signal? ( stoch 100 and 300 are close to 100, candle and ema1 are outside bollinger).
 
 
  • Post #17
  • Quote
  • Jan 25, 2017 9:07am Jan 25, 2017 9:07am
  •  metta87
  • | Joined Jul 2012 | Status: Member | 1,159 Posts
Attached Image (click to enlarge)
Click to Enlarge

Name: fail.png
Size: 80 KB
Attached Image (click to enlarge)
Click to Enlarge

Name: fail.png
Size: 80 KB

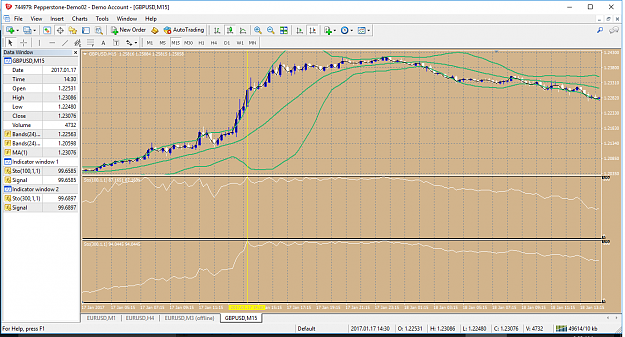
here is another example at yellow line, both stoch at 99.65 with candle and ema outside bollinger, price reverses at the 2nd candle. When to enter or exist could be a problem.
 
 
  • Post #18
  • Quote
  • Jan 25, 2017 10:52am Jan 25, 2017 10:52am
  •  acetrader
  • Joined Feb 2006 | Status: Member | 1,674 Posts
Quoting metta87
Disliked
{quote} hey ace, iobserved a lot of charts yesterday and what i see i that when price reach extremes on both stochs (above 98-below 02 ) and the candle and ema1 are outside bollinger, a reversal is coming. when ? i dont know, it can come in the next candle, the second the third. How much does it reverse ? sometimes it reverses past the point where the signal was given, sometimes it reverses very little. so sl and tp could be tricky. In your first signal to the left above, why would you enter there and not the candle prior to it since it also respects...
Ignored
metta your observations are spot on & just what I was expecting you would see. These trades could be tricky. A majority of the
time PRICE does turn in the direction of the signal given, but it could take several minutes up to several hours to make the turn.
Its all up to the trader to decide what to do. Let me know if you dig deeper into this.
Thank you for your views.
__________________________
 
 
  • Post #19
  • Quote
  • Jan 30, 2017 10:02am Jan 30, 2017 10:02am
  •  AntiCre
  • Joined Jul 2015 | Status: Member | 477 Posts
Hi @acetrader. I've deeply studied EUs ideas and come to the conclusion that there are things like contradictions. However, I can't see why prices should return to the areas where those contradictions occured. If you are interested in, here is a link to another forum where I posted my results ...
CrucialPoint: "I'm alpha". AntiCre: "I'm your Omega - the end."
 
 
  • Post #20
  • Quote
  • Jan 30, 2017 10:07am Jan 30, 2017 10:07am
  •  acetrader
  • Joined Feb 2006 | Status: Member | 1,674 Posts
Quoting AntiCre
Disliked
Hi @acetrader. I've deeply studied EUs ideas and come to the conclusion that there are things like contradictions. However, I can't see why prices should return to the areas where those contradictions occured. If you are interested in, here is a link to another forum where I posted my results ...
Ignored

Thank you. I'll take a look.
 
 
  • Trading Discussion
  • /
  • Similarity Present Day
  • Reply to Thread
    • Page 1 2
    • Page 1 2
0 traders viewing now
  • More
Top of Page
Forex Factory Blog Updated: Alerting All Members
  • Facebook
  • Twitter
About FF
  • Mission
  • Products
  • User Guide
  • Media Kit
  • Blog
  • Contact
FF Products
  • Forums
  • Trades
  • Calendar
  • News
  • Market
  • Brokers
  • Trade Explorer
FF Website
  • Homepage
  • Search
  • Members
  • Report a Bug
Follow FF
  • Facebook
  • Twitter

FF Sister Sites:

  • Metals Mine
  • Energy EXCH
  • Crypto Craft

Forex Factory® is a brand of Fair Economy, Inc.

Terms of Service / ©2022