Joined Feb 2012
|
Status: Trade like Water
|3,383 Posts
Double Crossovers
Two moving averages can be used together to generate crossover signals. Double crossovers involve one relatively short moving average and one relatively long moving average. As with all moving averages, the general length of the moving average defines the timeframe for the system. A system using a 5-day EMA and 35-day EMA would be deemed short-term. A system using a 50-day SMA and 200-day SMA would be deemed medium-term, perhaps even long-term.
A bullish crossover occurs when the shorter moving average crosses above the longer moving average. This is also known as a golden cross. A bearish crossover occurs when the shorter moving average crosses below the longer moving average. This is known as a dead cross.
Moving average crossovers produce relatively late signals. After all, the system employs two lagging indicators. The longer the moving average periods, the greater the lag in the signals. These signals work great when a good trend takes hold. However, a moving average crossover system will produce lots of whipsaws in the absence of a strong trend.
There is also a triple crossover method that involves three moving averages. Again, a signal is generated when the shortest moving average crosses the two longer moving averages. A simple triple crossover system might involve 5-day, 10-day, and 20-day moving averages.
Joined Feb 2012
|
Status: Trade like Water
|3,383 Posts
Candlestick Chart Patterns
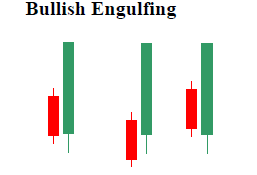
Engulfing (Bullish)
Bullish Engulfing pattern is formed when a small solid Candlestick is followed by a large hollow Candlestick which completely 'engulfs' the smaller Candlestick. It indicates that the buyers have taken control of a stock's price movement from the sellers.
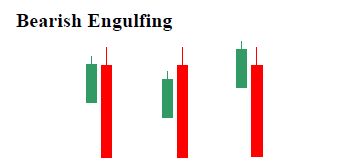
Engulfing (Bearish)
Bearish Engulfing pattern is formed when a small hollow Candlestick is followed by a large solid Candlestick which completely ‘engulfs’ the smaller Candlestick. It indicates that the sellers have taken control of a stock’s price movement from the buyers.
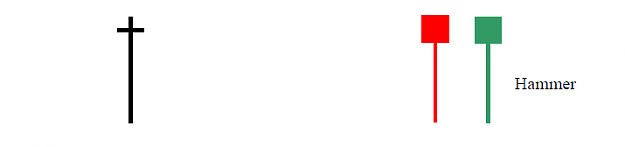
Hammer (Bullish)
Hammer candlestick is formed when a stock moves significantly lower than the opening price but rallies in the day to close above or near the opening price.
Shooting Star (Bullish)
Shooting Star candlestick is formed when a stock moves significantly higher than the opening price but rallies in the day to close below or near the opening price. It is an inverted Hammer.
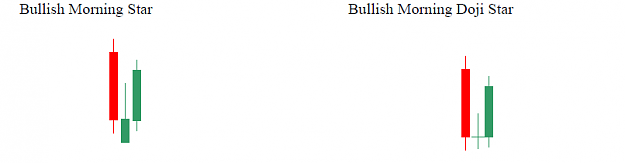
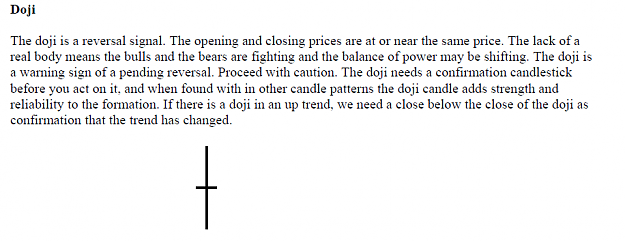
Doji
Doji candlesticks form when a stock's open and close are almost equal. The length of the upper and lower shadows can vary, and the resulting candlestick looks like a cross, an inverted cross, or a plus sign. A Doji indicates a sense of indecision between buyers and sellers.