as you know we have bid price charts in meta trader and you can see ask line price in realtime only . the brokers have a huge weapon and the name is SPREAD
it is very ordinary for me to stopped by widen of spreads in cross instruments or other infamous pairs like usd.zar and.....
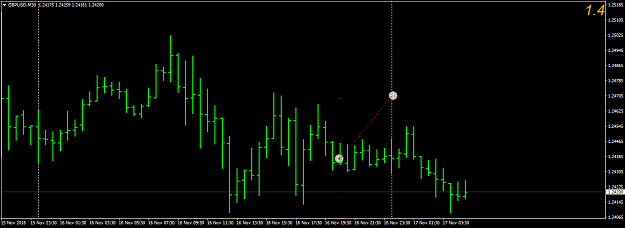
but in major instruments like eur/usd or gbp/usd or usd/jpy most of time in a working week spreads are ranging between some acceptable numbers , even in big news but these days brokers have found a very easy way to take your money in excuse of lack of volatility or liquidity at 00 .00 hour of charts and you cannot even complaint about it like this image, i only wanna know is there a way to see the historical chart of ask price of a broker to determine better for be the client that of that broker or not ?
it is very ordinary for me to stopped by widen of spreads in cross instruments or other infamous pairs like usd.zar and.....
but in major instruments like eur/usd or gbp/usd or usd/jpy most of time in a working week spreads are ranging between some acceptable numbers , even in big news but these days brokers have found a very easy way to take your money in excuse of lack of volatility or liquidity at 00 .00 hour of charts and you cannot even complaint about it like this image, i only wanna know is there a way to see the historical chart of ask price of a broker to determine better for be the client that of that broker or not ?
Attached Image (click to enlarge)