Hello guys! I don't write this because I am a good person, I write this because I am bored and because I see a lot of hilarious trading systems and claims. I also see a lot of confusion among rookies and not only.
Guys, the price can only go up or down, up or down, not to the left and not to the right. Up and down guys, up and down, don't forget this. More, the price can go up or down, it can't go up and down in the same time, right!?
Ok, now, there are two big stages of price behaviour: consolidation (consolidation in a range, ranging) and trending. This is all folks, consolidation and trending. When you look at a chart you will see this two big stages of price, consolidation and trending, no matter what time frame you are looking at. Consolidation and trending!!!!!
Now, the consolidation can be an accumulation or a distribution, does not really matter.
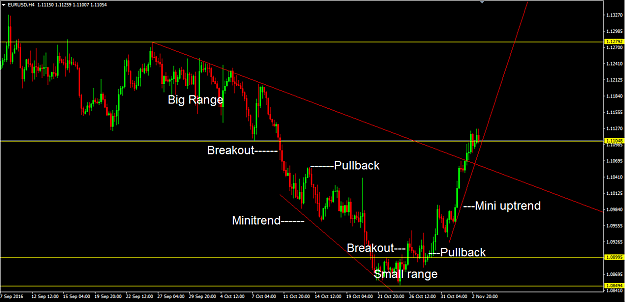
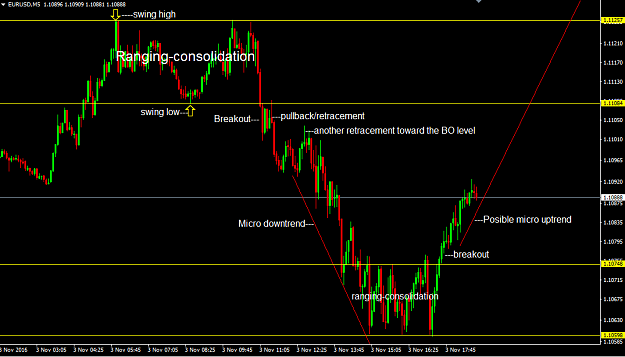
So, the price is consolidating in a range, the range can be smaller or bigger, does not really matter again, but, at one momment, the price will BREAK-OUT from the consolidation area and will start to trend. So, the break-out is very important. After the break-out, the price can start to trend, up or down or can start to re-consolidate on a new levels or the price can even go back into the previous consolidation area. When the price is going back to the previous consolidation area we call this a false break-out. Usual, if the break-out is genuine, the price will retrace a bit to the consolidation area before will continue in the direction of the breakout.
Look at the attachements, you will see how the price is consolidating, then the breakout and then the trend (even if is a minitrend), I have attached 2 charts, one 4 HR TF and one 5 min TF.
Now, usual, when the price is trending the trend will have a few retracements on the way and you can jump in the trend using this retracements. When the price is consolidating-ranging, you can trade the range buying and selling the extrems of the range. This is simple guys. I don't believe in fibs, elliot waves. Within a trend there are a few waves but verry rare 5 waves.
Guys, all the indicators are useless and anyway most of you don't know how to use them correctly but there is a way that you can use an oscilator, is to spot price divergences. Many times, not allways, a divergence is an early indication of a trend change or anyway, an indication that the trend is over or is slowing. However, there are hidden divergences that are indications of trend continuation. You need to learn about this.
Now, the more you trade the more you risk. So, scalping and day trading is the holly grail for the brokers because they collect the spread and they also know that you will eventualy lose your money sooner or later.

