It's funny, as soon as we were writing this technical analysis the channel had just broken. It's a post that we believe is good to see for you new traders.
The Canadian dollar was weighed by declining oil prices on Friday, as concerns over a rise in U.S. crude supplies.
The technical drawing indicates that the pair has bounced off the the 200 DMA (purple line) as support. The pair seems to be on a bullish course since RSI is shows a bullish path. With that set, a really strong resistance point is showing at 1.3188, and support stands at......For more: http://www.navigationfx.com/usdcad-technical-analysis-6/
The dollar is still on track to posts its worst start in 2017, since January since 2008. The US dollar weakened against all of it’s majors for the second day on Tuesday, weighing down on stock prices of Asian exporters and technology firms, following Wall Street declines amid concerns over Donald Trump’s tightening and quite frankly frightening US immigration rules.
Shawn Dawson from the Financial Times has a story that President Trump’s top trade adviser has accused Germany of currency exploitation.
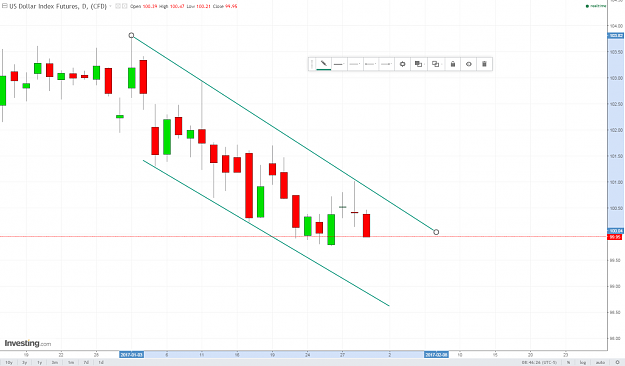
We see on the technical analysis that the US Dollar Index has formed a bearish channel. The channel was tested once again yesterday (Monday) and sellers continue to enter the market. If the channel were to break, if we see it go down 99.49 would act as great support. Resistance points at 100.70.....For more: http://www.navigationfx.com/dollar-i...ical-analysis/
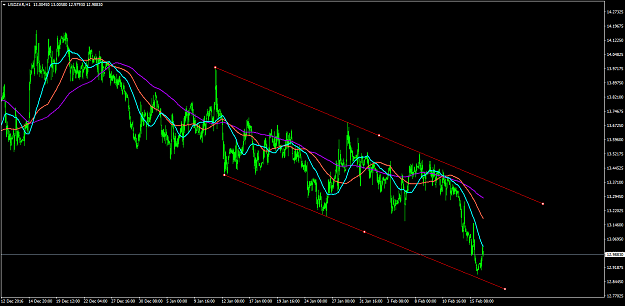
The Canadian dollar was weighed by declining oil prices last Friday, as concerns over a rise in U.S. crude supplies. Today news came out that Saudi Arabia’s Falih welcomes US Oil supply as long as it grows with global energy demand, and believe that OPEC will have a healthy dialogue with US administration. We see the pair has been affected by depreciating of the Dollar Index.
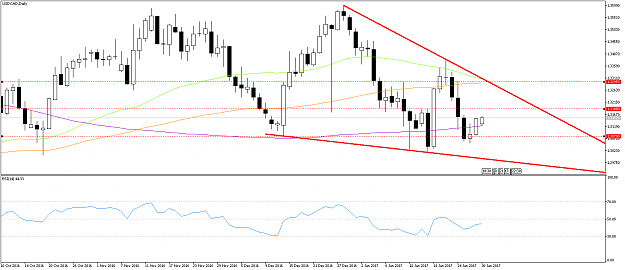
The technical graph shows a bearish pattern forming a right-angled triangle with a strong support at 1.3008. If the support of the triangle were to break, it is said that the height of triangle will be the fall in the currency, in this case 350 Pips.
If the case were to be true, which RSI seems to suggest as it is bearish at 43 we would see the parity tending towards the support of 1.2967, if the....For more: http://www.navigationfx.com/usdcad-t...al-analysis-7/
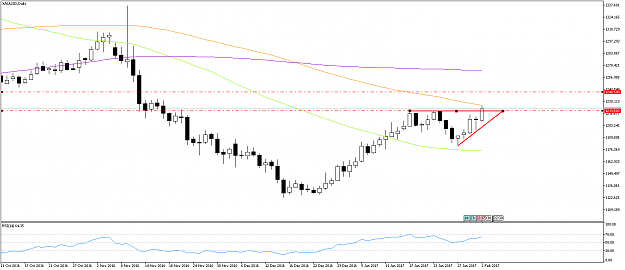
Today’s Technical Analysis a ‘Golden Triangle’ - XAUUSD/Gold
With the continuing apprehension of Trump on the markets, investors have request for a safe harbor led to the continuation of the bulls below the ONS. The dollar index (USDX) continues to face pressure, with the index down at lows of 99.28. Gold’s 1218.00 – 1220.00 resistance consistently being tested, however failing to pass.
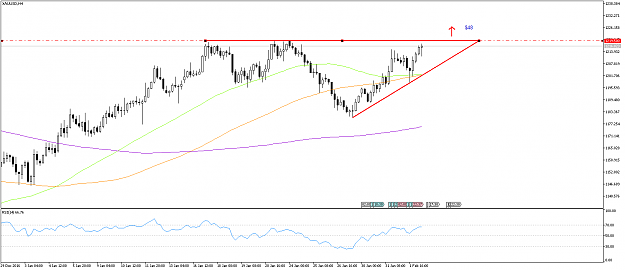
Looking at the technical graph, we are confronted with the rising triangle formation. If the triangle is to break, then it is said that the height of the triangle ($38) will be the increase set on the parity. The formation implies that the ascension can continue towards the... For more: http://www.navigationfx.com/xauusd-g...ical-analysis/
Technical Analysis: Where will gold continue to go next?
Following our earlier technical analysis on the Golden Triangle – Gold passed the 1218.00 – 1220.00 resistance, where it is now lingering on the 100 DMA (Orange Line) as it’s new resistance.
Tomorrow’s US Unemployment Rate figures will be coming in at 13:30 GMT – if the results are to be weak, we will most likely see the dollar depreciate. Gold will then look pass the 100 DMA with the flood of buyers, we see a strong resistance at... For more: http://www.navigationfx.com/xauusd-g...ical-analysis/
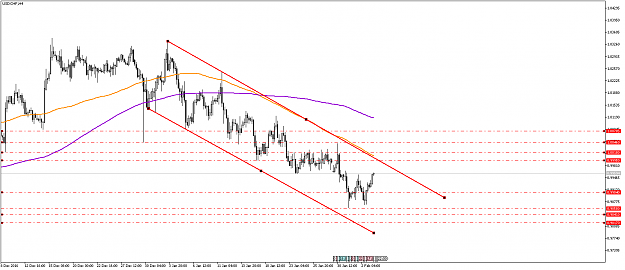
Technical Analysis: Swiss Franc May see major movement on US Unemployment Release
With continued uncertainty with Trump and his policies we saw significant bullish movements in safe havens such as Gold, Japanese Yen and the Swiss Franc. Today’s US Unemployment Rate figures will be coming in at 13:30 GMT – if the results are to be weak, we will most likely see the dollar depreciate, meaning the USDCHF will appreciate and vise versa.
Technically we can see the a channel has been formed and I will explain the two scenarios.
Scenario 1 – Good US Unemployment Figures
CHFUSD is expected to appreciate/increase on the result. If the channel is to break, it is said the height of the channel will be the increase in the parity, as it makes its price adjustment. We have labelled key resistance points, including 0.9995 (100DMA Daily Moving Average – Orange Line) could act as a resistance. However, if selling momentum is strong, it may well pass through to 1.0018. Further resistance areas include 1.0046 and 1.00800.
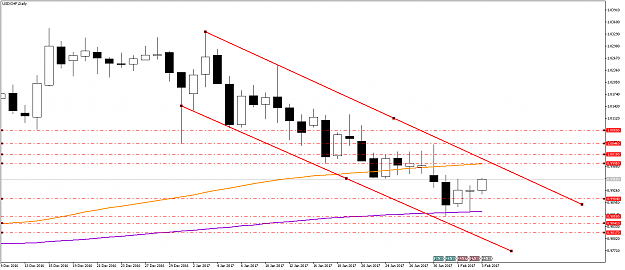
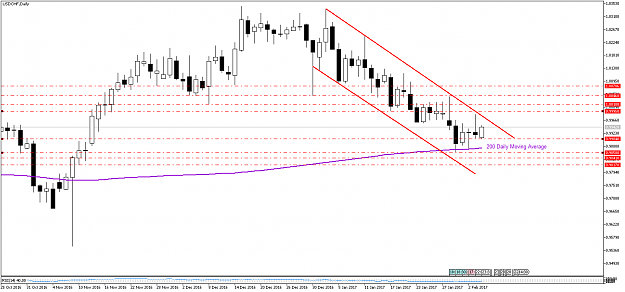
USDCHF Technical Analysis shows the parity acting as support on the 200DMA
We continue to see the dollar index decline from 103.70 to 100.00 as continued pressure mounts on the USDCHF. Moreover, the appreciation in the Swiss Franc stands out as a safe haven, accelerating the downward movement of the pair.
As per the last technical analysis posted on Friday the parity approaches the 0.9870 region, where it has acted as a critical support on the 200 Daily Moving Average (Purple Line).
In the past days, there has been a reaction to the declines with the downward trend starting from 1.0330, gaining a significant resistance featured... For more: http://www.navigationfx.com/technica...sdchf-200-dma/
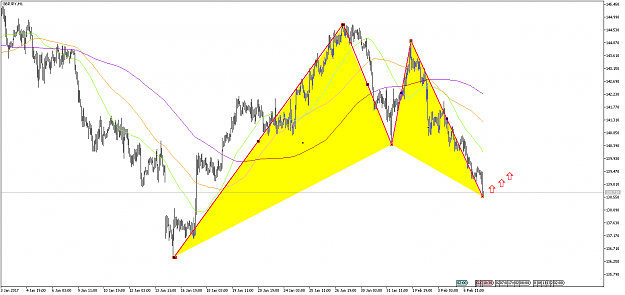
The pound is under pressure again led by GBPJPY selling.
The GBPJPY technical drawing shows an eye catching bullish Gartley formation.
The formation shows a strong support settled at 138.48 138.50. The Gartley formation implies that there may be slight increase in levels after the downturn.... For more: http://www.navigationfx.com/technica...february-2017/
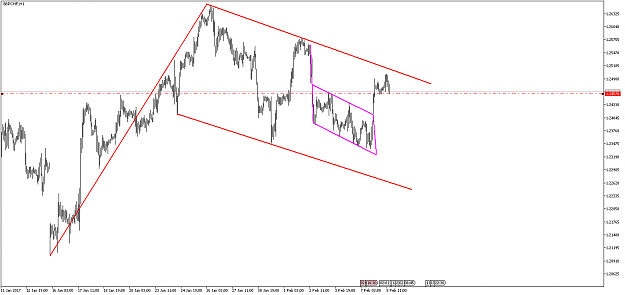
The Pound/Swiss Franc cross is a lower volatility pair that is tempered by the currencies' economic and geographic proximity. The Swiss Franc is considered a benchmark safe haven currency due to its history as a refuge for wealthy individuals from foreign shores looking to safe guard capital. The Pound is currently facing pressure with Brexit looming and recent developments include a chunk of the country's financial center may be moving to Frankfurt.
We see a flag formation has formed. The flag includes the pole (bullish sentiment) and the flag (bearish channel). If the head of the channel is to be tested again, we would likely see a breakout. If the channel is to break, then it is said that the height of the channel (213 pips) will be the increase set on the parity.
Definitely something to keep out for.
Trading within the channel, we see a strong support formed at 1.2457. However, resistance areas would highly likely break the channel.
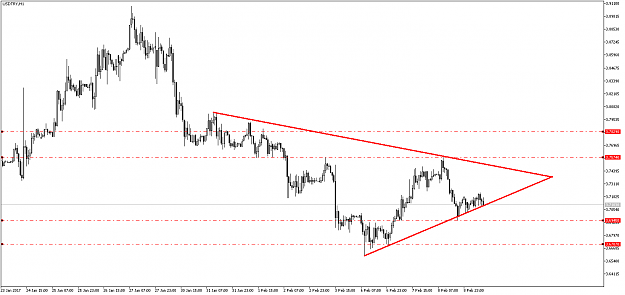
The Turkish Lira is one of the most volatile currencies since the continued pressure with Government crackdowns and the PM Recep Erdogan’s Referendum coming up in May this year.
The USDTRY technical drawing shows an eye catching pennant formation.
The formation shows a strong support trend line that has been tested many times.
If there were to be a strong breakout up, resistance points include 3.7574 and 3.78290.
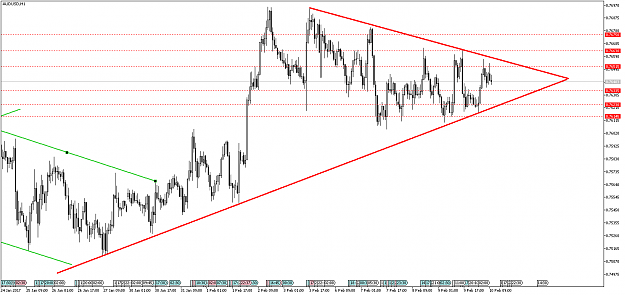
AUDUSD has had an interesting path to say the least. Recent developments include the higher commodity prices and the higher USD. Today's Trade Balance data increased AUD strength as the Aussies coupled with China in bear markets in metals and many commodities, have created a more opaque picture of the future of Australia's financial prospects.
AUDUSD can see a nice triangle formation being formed on the hourly chart.
Resistance areas include: 0.76515, 0.76630 and 0.76750
Support areas include: 076335, 0.76230 and 0.76145
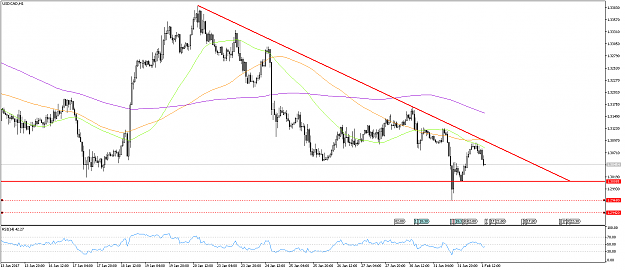
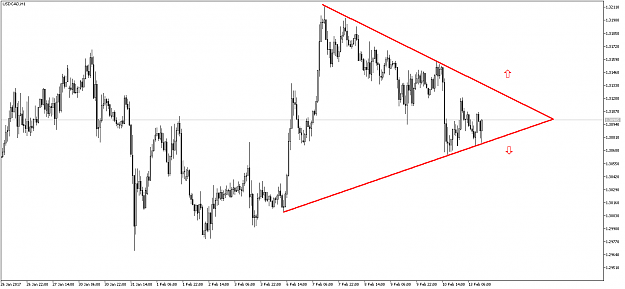
Recent bullish run of oil prices has depreciated the USDCAD, along with the stronger Canadian dollar. When we look technically, we see a triangle formation formed.
The resulting symmetrical triangle formation implies that if the triangle is broken downwards or upward, a hard price movement may be experienced. It is particularly useful to pay attention to the 1.3100 – 1.3120 resistance above... For more: http://www.navigationfx.com/technica...february-2017/
Today’s Technical Analysis: SOUTH AFRICAN RAND BEARISH CHANNEL
Moving away from then majors, the Pound in the late 50’s to early 60’s, the Rand was established and is well known as the current legal tender for South Africa, Swaziland, Lesotho and Namibia. The rand looks to benefit when investors are willing to take on more risk in developing countries. Any pullback in risk from global markets pushes the Rand significantly lower as seen during the financial crisis of 2008.
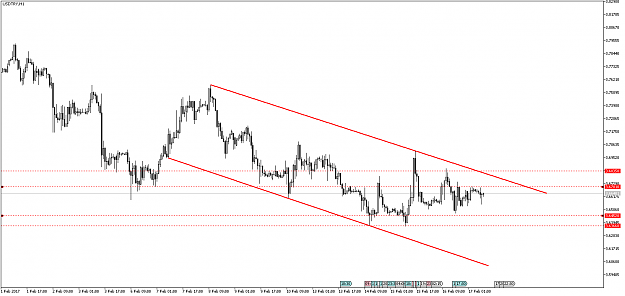
Looking at this technical graph we see a bearish channel formation which begun on the 11th January 2017. The 50 H1 Moving Average (Blue Line) and if you look at the M30 100 Moving Average it has acted as a resistance for the parity today and sellers have entered the market
The Turkish Lira is one of the most volatile currencies since the continued pressure with Government crackdowns and the PM Recep Erdogans Referendum coming up in May this year.
The latest developments include Turkeys FX Sector had a surprise last Friday morning where the CMBT (Capital Market Boards of Turkey) and SPK introduced regulation where clients must have a minimum deposit of 50,000 Turkish Lira and can have leverage of 10:1.
We see on the technical analysis that a bearish channel has formed during the past 10 days. The key resistance point is 3.6701, if this were to pass the following resistance point could well be 3.6835, making the channel break upwards.
However, it is still unlikely we will see any breakages yet as there is not much news from the USA next week. Key support areas outlined include 3.6452 and 3.6366.... For more: http://www.navigationfx.com/technica...february-2017/