//@vesion=3
study(title="Snoopy 3MA",overlay = true, shorttitle="Snoopy3MA")
inp1stMA = input(10, title="1stEMA-Fastest", type=integer)
inp2ndMA = input(20, title="2ndEMA-Slow", type=integer)
inp3rdMA = input(50, title="3rdSMA-Slowest", type=integer)
inp4thMA = input(100, title="4thSMA-Slowest", type=integer)
EMA1 = ema(close, inp1stMA)
EMA2= ema(close, inp2ndMA)
SMA3 = sma(close, inp3rdMA)
SMA4 = sma(close, inp4thMA)
// Define colors for the MAs
co1 = EMA1[1] > EMA1[2] ? green : EMA1[1] < EMA1[2] ? red : yellow
co2 = EMA2[1] > EMA2[2] ? green : EMA2[1] < EMA2[2] ? red : yellow
co3 = SMA3[1] > SMA3[2] ? green : SMA3[1] < SMA3[2] ? red : yellow
co4 = SMA4[1] > SMA4[2] ? green : SMA4[1] < SMA4[2] ? red : yellow
// Plot the MAs
Plot1=plot (EMA1, color = co1, linewidth = 1, title = "1stEMA")
Plot2=plot (EMA2, color=co2, linewidth=2, title='2ndEMA')
Plot3=plot (SMA3, color = co3, linewidth=3, title="3rdSMA")
//Plot4=plot (SMA4, color=co4, linewidth=3, title="4thSMA")
fill(Plot1,Plot2,co1,transp = 90)
//fill(Plot3,Plot4,co3,transp = 90)
// Notify when the MA ribbon first forms
bear = (EMA1<EMA2 and EMA2<SMA3) and not (EMA1[1]<EMA2[1] and EMA2[1]<SMA3[1])
bull = (EMA1>EMA2 and EMA2>SMA3) and not (EMA1[1]>EMA2[1] and EMA2[1]>SMA3[1])
// Plot buy sell signals based on MA ribbon
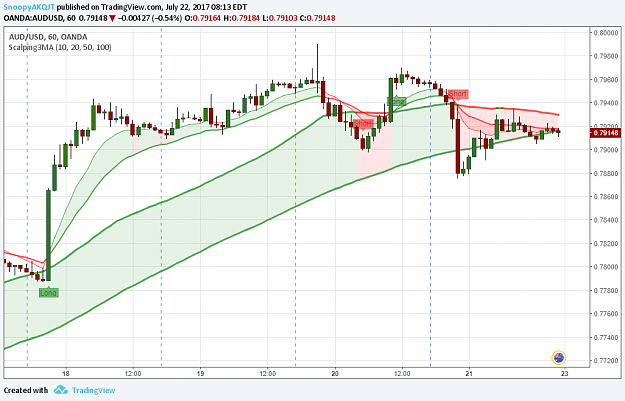
//plotshape(bull,"Buy",shape.labelup,location.belowbar,green,text="Long",textcolor=black,transp=50)
//plotshape(bear,"Sell",shape.labeldown,location.abovebar,red,text="Short",textcolor=black,transp=50)
// buy sell signals based on MACD
[macdLine, signalLine, histLine] = macd(close, 12, 26, 9)
bull1=(histLine>0 and close>SMA3) and not (histLine[1]>0 and close[1]>SMA3[1])
bear1=(histLine<0 and close<SMA3) and not (histLine[1]<0 and close[1]<SMA3[1])
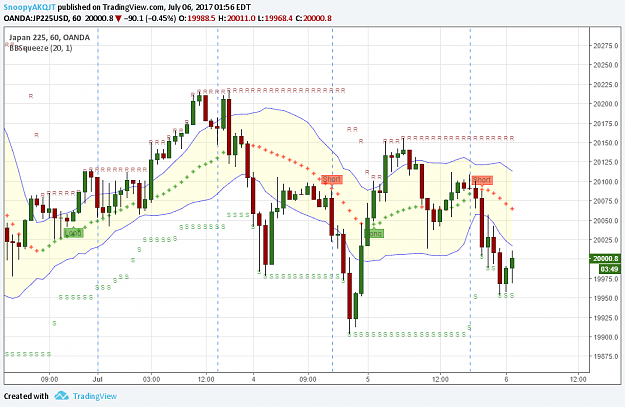
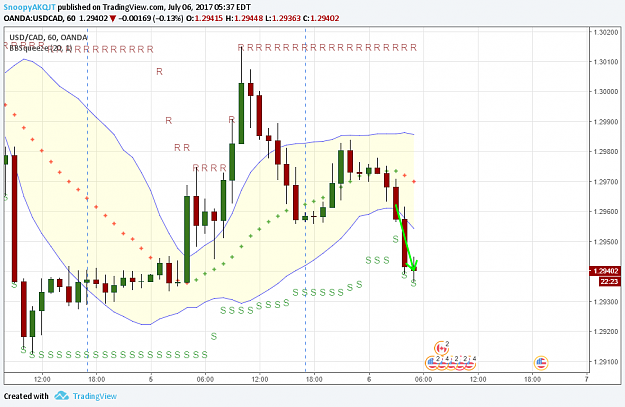
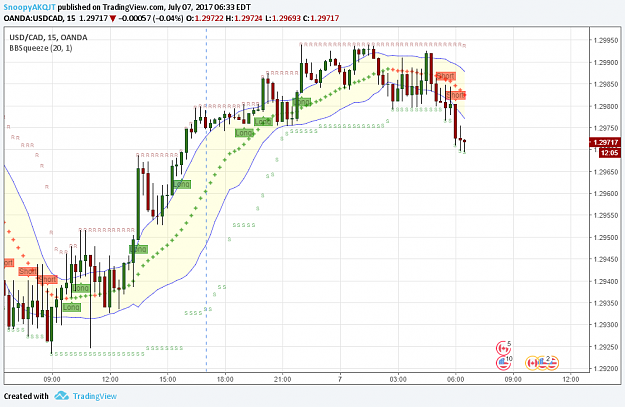
plotshape(bull1,"Long",shape.labelup,location.belowbar,green,text="Long",textcolor=black,transp=50)
plotshape(bear1,"Short",shape.labeldown,location.abovebar,red,text="Short",textcolor=black,transp=50)
// Plot S and R
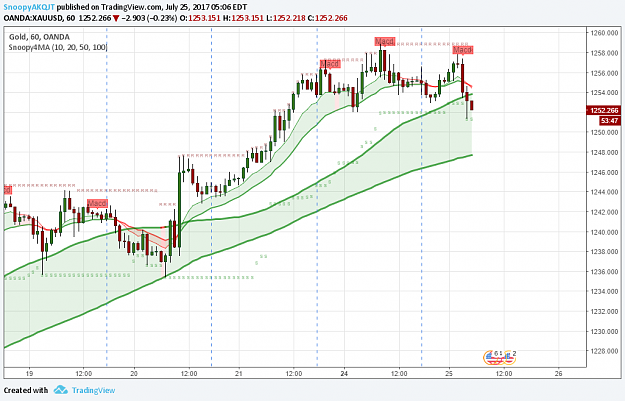
plotchar(highest(20),color=maroon,title="Resistance",char="R",location=location.absolute)
plotchar(lowest(20),color=green,title="Support",char="S",location=location.absolute)
//End of Script Snoopy3MA