{quote} Thanks again for you views and please don't take it as critique, I am not saying you are doing anything wrong. I am just trying to understand how your mental processes works around this system so I can better understand it. Like you, I have no statistics on price behaviour around these levels. However, after having spent thousands of hours watching FX prices move, I do believe there's some relevancy to my claims in previous post. However, I am not going to hijack your thread here and talk about how I take them into account.
Ignored
I understand where you are comming from. But mind that for mechanical profitable system all it matters is past research tied to mathematics. You can have unlimited amount of hours watching instruments, if you havent done homework its useless becouse you have no high statistical probability of being profitable in month B just like you were in month A, executing the same thing over and over again. Thats why any research or idea tied to system has to be researched, only then it means something, becouse every single thing about how you trade (risk, profits, volatility, adjusting) has to be put into that equasion. So if you have information that you think its relevant, its only relevant if you have some edge on that information.
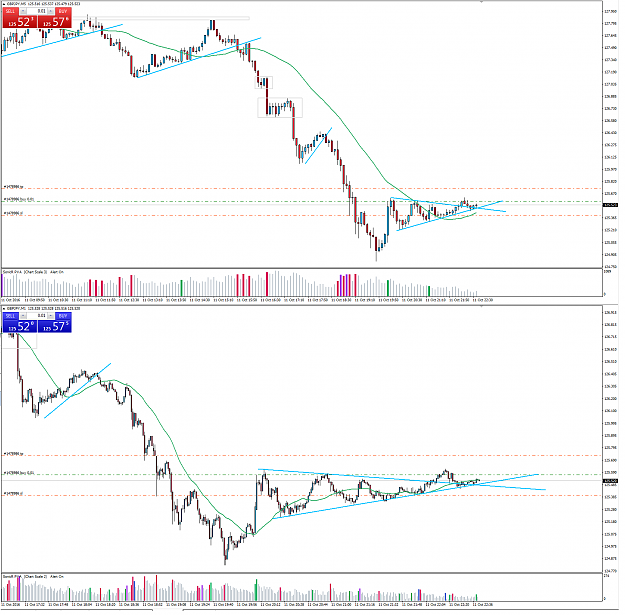
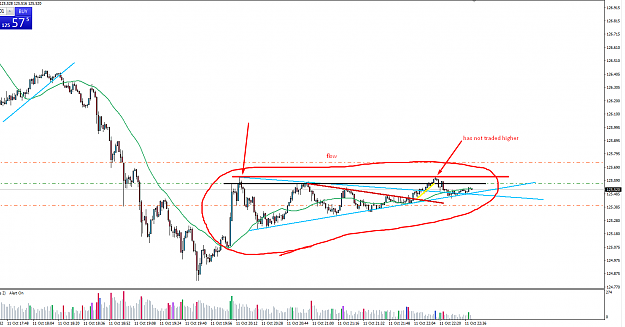
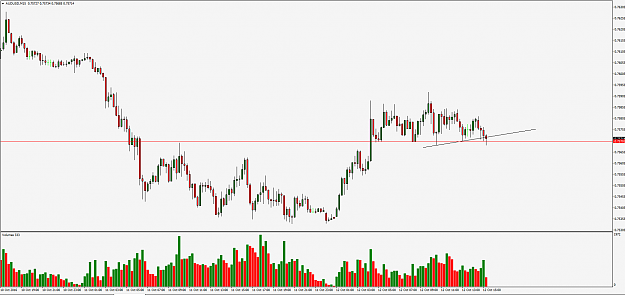
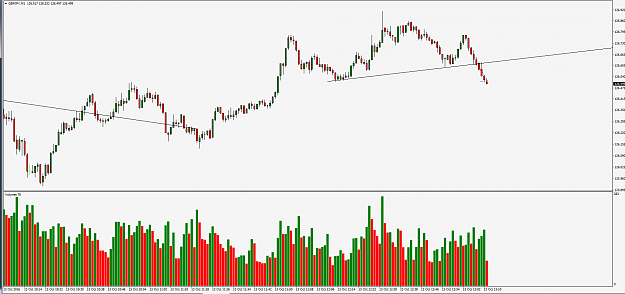
This is good example how you were stoped out just becouse you were late in entry. Look at correctly drawn trendlines acording to relative price action. If you drawn correctly you would actually won, but being late made you lose the trade. As i said many times before, last two major highs or lows are the most important, after you get print of those two new highs stop looking at any other highs or lows in history becouse it doesnt matter in terms of near term change.
Attached Image (click to enlarge)
If you would take whole structure as breakout example and having that strongest left high as breakout you need to see that resistance to be taken of by candle close thats when you usually unlock larger upper move. But there was no candle close above in this case if you draw resistance.
{quote} This is good example how you were stoped out just becouse you were late in entry. Look at correctly drawn trendlines acording to relative price action. If you drawn correctly you would actually won, but being late made you lose the trade. As i said many times before, last two major highs or lows are the most important, after you get print of those two new highs stop looking at any other highs or lows in history becouse it doesnt matter in terms of near term change. {image}
Ignored
Ok you made me in mistake before ; ) I Thought to search trendlines on M5 and then switch to M1. So now i see Its searching on M1 and M1 entering
Agree 100%. In the spirit of sharing, here's a good tip I wish somebody had told me when I was starting out: I use Ninjatrader market replay functionality to test out new strategies. With that function you can replay any day in the past for as many pairs (or other instruments) as you want. So I have 4 screens and with 4 pairs per screen that totals 16 pairs. It's exactly like real trading except you can "fast forward". Using Ninjatrader is absolutely free (until you go live) . I am in no way affiliated with Ninjatrader.
Only thing is their function for dowloading replay data sucks. I have automated the process of doing that using a macro I found. PM me if you want it.
Agree 100%. In the spirit of sharing, here's a good tip I wish somebody had told me when I was starting out: I use Ninjatrader market replay functionality to test out new strategies. With that function you can replay any day in the past for as many pairs (or other instruments) as you want. So I have 4 screens and with 4 pairs per screen that totals 16 pairs. It's exactly like real trading except you can "fast forward". Using Ninjatrader is absolutely free (until you go live) . I am in no way affiliated with Ninjatrader. Only thing is their function...
Ignored
Thanks for pointing that out. I havent pointed it out perhaps i should do so. For anyone who is learning this strategy its critical that strategy is backtested by drawing and paper trading on historical data before doing it on realtime. Hundreds or thousands of historical repetitions will get you more mechanical and better statistical results in what one should expect for system to perform in future.
There are many ways to do that, you can do it trough MT4 historical data, other softwares that provide you to actually trade forward data (paid), or some that provide paper trading also forward data for free, not going to do any promotions here just to be safe.
But yes doing homework before you actually trade it is extremely important that is only way to grasp the system with at least emotions as possible. That way you know exatctly how to react around the pattern that you trade no matter of time, volatility or chance by default. Exotics could be less corelated yes, but it very much depends what kind have you picked, if you have picked M1 tradeable then they are very much USD dependent which means pretty much correlated.
Hm.....4 screens each having 4 pairs, means that you have 4 pairs if they are correlated. That is 4 oportunites to entry, not 16.
Not sure how you filter them but, 4 USDs, 4 Cads, 4 exotics and 4 crosses is in total usually 4 oportunites, defenetly not 16, defenetly bellow 10 at maximum.
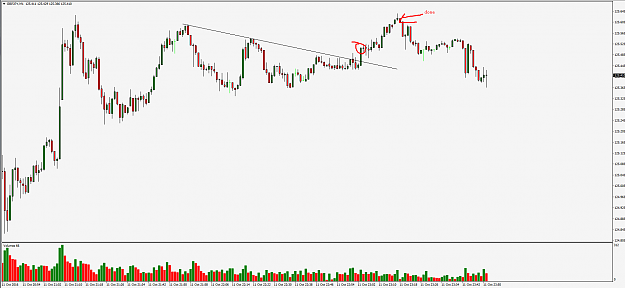
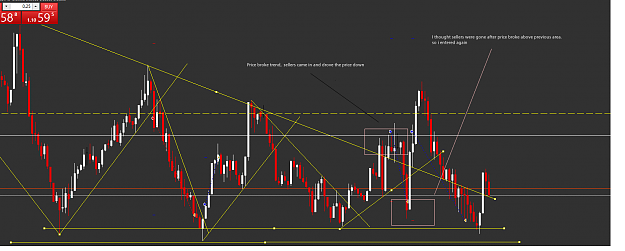
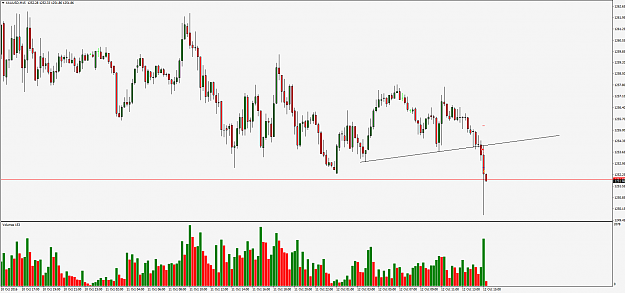
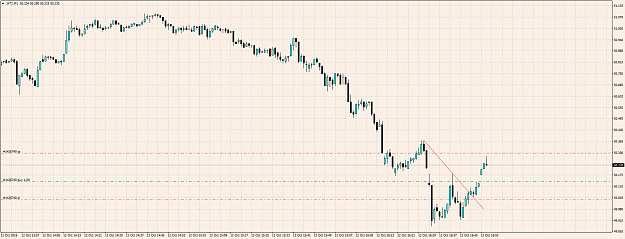
Jan, I entered this trade I posted earlier today and it didnt work. Do you think it could have been prevented or managed better? What is your take on it? Thanks!
I lost 14 pips combined.
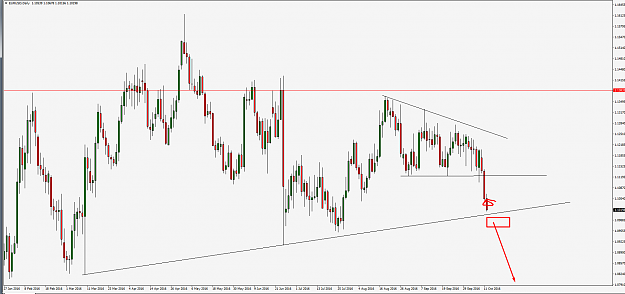
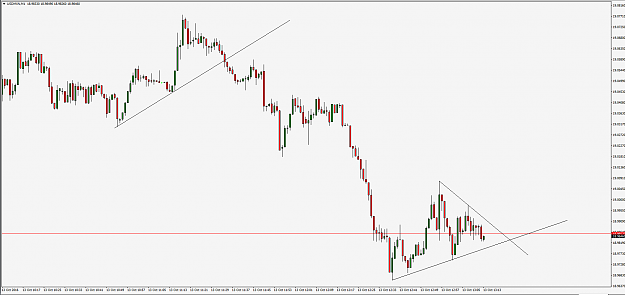
Just to give my 2 cents. Look the image below... If you draw some horizontal lines where SR are present (black lines) you could have avoided that trade altogether. If you are familiar with simple patterns we know that price will form a flag, pennant, or triangle after the impulse leg, therefore considering that resistance level where you got stopped would have saved you. As Jan pointed out, if you had made your entry earlier you could expect the price to move until that resistance where you would had taken profits out. I'm still working on this strategy myself so keep posting your wins and losses so we can all learn from each other. As a matter of fact, I also use higher TF like you do. I look for impulse leg in the 1H/15M to trade in the main direction. I had 80%+ results when trading with the main direction, but had only 40/50% when trading both directions, which is why I'm here trying to learn with you guys to see If I can improve that aspect.
{quote} Just to give my 2 cents. Look the image below... If you draw some horizontal lines where SR are present (black lines) you could have avoided that trade altogether. If you are familiar with simple patterns we know that price will form a flag, pennant, or triangle after the impulse leg, therefore considering that resistance level where you got stopped would have saved you. As Jan pointed out, if you had made your entry earlier you could expect the price to move until that resistance where you would had taken profits out. I'm still working...
Ignored
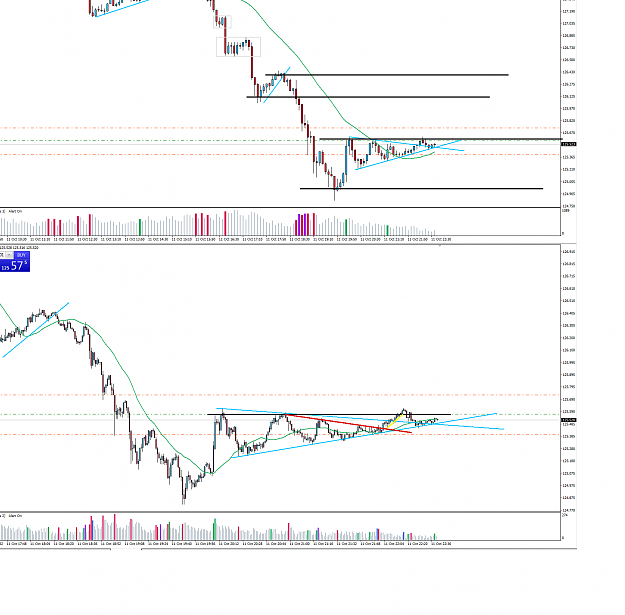
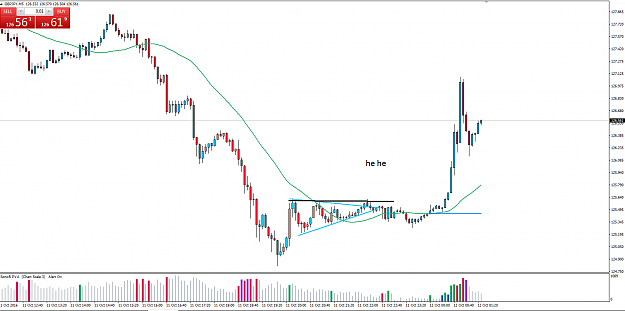
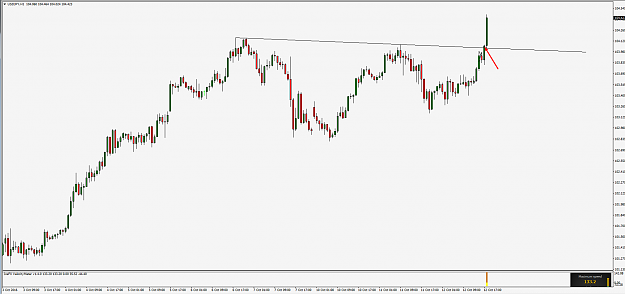
Yes the whole structural high has to trade higher with candle closes in order to validate further upside movement. However the black resistance line that you drawn should be from the strongest high point of that last high in order to validate it. The longer the price trades above it the more valid it is, basically the oposite of what 90% of trading information is going to tell you (trade bounces when price hands around for while).
Deconstruct the matrix, deconstruct the price. The thinner you get the lower the risk, the larger the swing of where your aim is, if applicable to high probability expectations. This is how RR profile moves in everything in universe.
A lion knows to attack unknowing gazelle becouse his energy consumed will be very little in what the reward could be if sucessfull. A crocodile does not attack hippo becouse his chances are not very good to outstand battle without dying later on, a human eats a peddle of rice becouse the chances of it being poisoned are very low at any case. Everything moves in patterns that are highly related to good probabilites, its about finding them and executingg them in market aswell. As bland as i puted that was, its how the brain works to react.
The funny thing is, that markets can be traded on short scales only becouse at the same time you think there is high probability for something to go up, someone else things exactly the oposite, which creates the liquidity. Reasons dont matter, but the results do in terms of price scale.
{quote} Yes the whole structural high has to trade higher with candle closes in order to validate further upside movement. However the black resistance line that you drawn should be from the strongest high point of that last high in order to validate it. The longer the price trades above it the more valid it is, basically the oposite of what 90% of trading information is going to tell you (trade bounces when price hands around for while). {image}
{quote} Just to give my 2 cents. Look the image below... If you draw some horizontal lines where SR are present (black lines) you could have avoided that trade altogether. If you are familiar with simple patterns we know that price will form a flag, pennant, or triangle after the impulse leg, therefore considering that resistance level where you got stopped would have saved you. As Jan pointed out, if you had made your entry earlier you could expect the price to move until that resistance where you would had taken profits out. I'm still working...
Ignored
Hey, thanks nice, How do you have 80% reults ?? Share with us please ...