• Home
  • Forums
  • Trades
  • News
  • Calendar
  • Market
  • Brokers
  • Login
  • Join
  • User/Email: Password:
  • 8:58am
Menu
  • Forums
  • Trades
  • News
  • Calendar
  • Market
  • Brokers
  • Login
  • Join
  • 8:58am
Sister Sites
  • Metals Mine
  • Energy EXCH
  • Crypto Craft

Options

Bookmark Thread

First Page First Unread Last Page Last Post

Print Thread

Similar Threads

The System Behind the System, by Merlin Jeffries 16 replies

Choppy and Trendy Markets 5 replies

Knife system, Vegas 4h system related questions. 4 replies

In your opinion, which pair is the least choppy (i.e most trendy)? 5 replies

Would you trade this system? New system #2. 10 replies

  • Trading Systems
  • /
  • Reply to Thread
  • Subscribe
  • 7
Attachments: TRENDY SYSTEM
Exit Attachments

TRENDY SYSTEM

  • Last Post
  •  
  • Page 1 2
  • Page 1 2
  •  
  • Post #1
  • Quote
  • First Post: Dec 15, 2007 7:22pm Dec 15, 2007 7:22pm
  •  hisham_gho
  • | Joined Apr 2006 | Status: Member | 24 Posts
hello friends

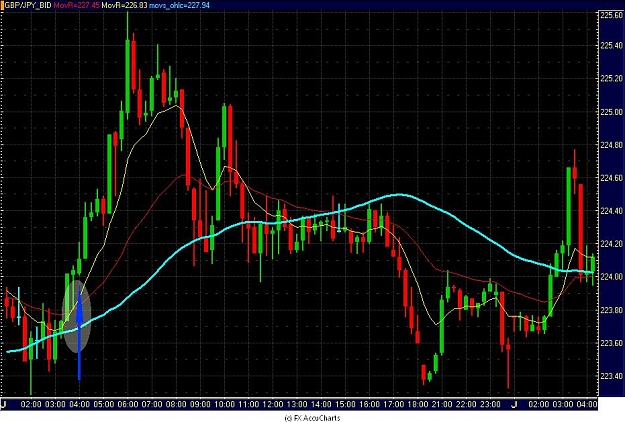
this is my first post here i'm hisham ghoneim from egypt i want to share with you my way to tarde on gbp/jpy on frame 15min but i will work on fxsol charts i hope u like the system i will explain it on 17/12/2007 because i will have 5 days vacation so untill the date i hope u prepare your programs and have a demo account on fxsol
  • Post #2
  • Quote
  • Dec 15, 2007 7:29pm Dec 15, 2007 7:29pm
  •  linuxstorm
  • | Joined Apr 2007 | Status: Member | 2 Posts
Hello Bro

welcome in ur 1st post and we wait ur exp sharing

have anice time
 
 
  • Post #3
  • Quote
  • Dec 16, 2007 3:56am Dec 16, 2007 3:56am
  •  Core
  • | Joined Jan 2006 | Status: Member | 21 Posts
Hi, I still waiting your next post
 
 
  • Post #4
  • Quote
  • Dec 17, 2007 12:09pm Dec 17, 2007 12:09pm
  •  WHTenn
  • Joined Nov 2006 | Status: Member | 1,758 Posts
Where did you go to?
 
 
  • Post #5
  • Quote
  • Dec 18, 2007 5:56am Dec 18, 2007 5:56am
  •  hisham_gho
  • | Joined Apr 2006 | Status: Member | 24 Posts
hi every one sorry for late but i have a problem with fxcharts so i will explain the indicators now and later i will upload the charts.
 
 
  • Post #6
  • Quote
  • Dec 18, 2007 7:29am Dec 18, 2007 7:29am
  •  hisham_gho
  • | Joined Apr 2006 | Status: Member | 24 Posts
our system will depend on three sides
1- tech.analysis ( 3 indecators )
2- numerical analysis ( 6 indecators )
3- cadels analysis (4 patterns )
we will catch the chane on frame 15m but we must keep watchin frame 1h&4h before entry
 
 
  • Post #7
  • Quote
  • Dec 18, 2007 8:07am Dec 18, 2007 8:07am
  •  hisham_gho
  • | Joined Apr 2006 | Status: Member | 24 Posts

Technical analysis :-
5&15 rolling moving average
This is to generate buy & sell signals as follow
If 5ma cross over 15ma from below this is buy signal
If 5ma cross below 15ma from above this is sell signal
we can find the definition of moving average rolling from fxsol charts programs as follow

Moving Average – Rolling

Description

The moving average may be the most widely used indicator. The Rolling Moving Average indicator calculates and plots a moving average of prices (closing prices), from each of the most recent number of bars specified by the Periods parameter. The Rolling Moving Average indicator assigns a weight to the price data as the average is calculated, though less weight is assigned to each later price in the series.

A moving average is generally used for trend identification. Attention is given to the direction in which the average is moving and to the relative position of prices and the moving average. Rising moving average values (direction) and prices above the moving average (position) would indicate an uptrend. Declining moving average values and prices below the moving average would indicate a downtrend
 
 
  • Post #8
  • Quote
  • Dec 18, 2007 9:11am Dec 18, 2007 9:11am
  •  Sampsun
  • | Joined Dec 2007 | Status: Member | 7 Posts
hey there hisham, im looking at the gbpjpy as well, i use MT4 and i dont see any rolling MA, how does that differ from the the other options?

thanks mate
 
 
  • Post #9
  • Quote
  • Dec 18, 2007 9:18am Dec 18, 2007 9:18am
  •  billbss
  • Joined Apr 2006 | Status: Member | 4,301 Posts
Quoting Sampsun
Disliked
hey there hisham, im looking at the gbpjpy as well, i use MT4 and i dont see any rolling MA, how does that differ from the the other options?

thanks mate
Ignored
From the description, it is the Linear Weighted MA.
 
 
  • Post #10
  • Quote
  • Dec 18, 2007 9:29am Dec 18, 2007 9:29am
  •  Sampsun
  • | Joined Dec 2007 | Status: Member | 7 Posts
ok, i was leaning in that direction, thanks for the fast response.
 
 
  • Post #11
  • Quote
  • Dec 18, 2007 12:24pm Dec 18, 2007 12:24pm
  •  WHTenn
  • Joined Nov 2006 | Status: Member | 1,758 Posts
Quoting hisham_gho
Disliked
our system will depend on three sides
1- tech.analysis ( 3 indecators )
2- numerical analysis ( 6 indecators )
3- cadels analysis (4 patterns )
we will catch the chane on frame 15m but we must keep watchin frame 1h&4h before entry
Ignored
Please post your indicators, instructions and if you need a program to take a snapshot of charts, pm me and I can hook you up.
 
 
  • Post #12
  • Quote
  • Dec 18, 2007 6:37pm Dec 18, 2007 6:37pm
  •  hisham_gho
  • | Joined Apr 2006 | Status: Member | 24 Posts
SECON INDECATOR IN TECH .ANALYSIS SECTION
SMA 55 APPLY TO OHLC
definition from fxsol charts

Moving Average OHLC


Description

OHLC stands for which field is used in the calculation of the moving average. The FidType in the indicator’s parameters determines which field is used.
FidType
Field used
1
Open
2
High
3
Low
4
Close


  • Post #13
  • Quote
  • Dec 18, 2007 6:52pm Dec 18, 2007 6:52pm
  •  hisham_gho
  • | Joined Apr 2006 | Status: Member | 24 Posts
generate a signal
*buy signal :- on frame 15m
1- the 5 ma cross over from below the 15 ma
2- the cross have two cases :-
CASE 1
THE CROSS ABOVE 55 SMA THIS MEANS THE CANDELS MUST BE ABOVE THE 55 SMA ( I CALL THE SIGNAL THE BEST )
CASE 2
THE CROSS JUST BELOW 55 SMA THIS MEANS THE CANDELS ARE JUST BELOW 55 SMA ( IT IS GOOD SIGNAL )

ENTRY POINT
IN CASE 1
WE WILL ENTER FROM THE NEXT CANDEL AFTER CROSS CANDEL
IN CASE 2
WE WILL ENTER FROM THE NEXT CANDEL BREAK 55 SMA AND CLOSE ABOVE

THIS IS THE SIMPLE WAY I TRADE WITH TREND ON SMALL FRAMES
BUT THIS IS NOT ALL THE RULES .
 
 
  • Post #14
  • Quote
  • Dec 18, 2007 7:22pm Dec 18, 2007 7:22pm
  •  hisham_gho
  • | Joined Apr 2006 | Status: Member | 24 Posts
Quoting WHTenn
Disliked
Please post your indicators, instructions and if you need a program to take a snapshot of charts, pm me and I can hook you up.
Ignored
THANKS ALOT BRO BUT I WANT TO EXPLAIN THAT THESE INDECATORS ARE IN FXSOL CHARTS PROGRAM AND I WILL ONLY BUT THE DEFINITIONS OF THE INDECATORS I WILL USE IN THIS SYSTEM .
 
 
  • Post #15
  • Quote
  • Dec 18, 2007 8:11pm Dec 18, 2007 8:11pm
  •  WHTenn
  • Joined Nov 2006 | Status: Member | 1,758 Posts
Thanks for the instructions. If you need help showing the charts, let me know

Good Luck
 
 
  • Post #16
  • Quote
  • Dec 19, 2007 6:11am Dec 19, 2007 6:11am
  •  hisham_gho
  • | Joined Apr 2006 | Status: Member | 24 Posts
The Two Charts Explain The Entry Point As Case 1
The Cross Happened Above 55 Sma As Buy Signal And Below 55 Sma As Sell Signal
Attached Images (click to enlarge)
Click to Enlarge

Name: case 1 - buy.JPG
Size: 114 KB Click to Enlarge

Name: case 1 - sell.JPG
Size: 112 KB
 
 
  • Post #17
  • Quote
  • Dec 19, 2007 6:19am Dec 19, 2007 6:19am
  •  hisham_gho
  • | Joined Apr 2006 | Status: Member | 24 Posts
The Next Two Charts Explain The Entry Point As Case 2
The Cross Happened Just Below 55 Sma As Buy Signal And Just Above 55 Sma As Sell Signal
The Entry Will Be @the Next Candel Break The 55 Sma Indecator And Close Above For Buy Signal Or Close Below For Sell Signal .
Attached Images (click to enlarge)
Click to Enlarge

Name: case 2 - buy.JPG
Size: 122 KB Click to Enlarge

Name: case 2 - sell.JPG
Size: 129 KB
 
 
  • Post #18
  • Quote
  • Dec 19, 2007 6:32am Dec 19, 2007 6:32am
  •  hisham_gho
  • | Joined Apr 2006 | Status: Member | 24 Posts
This Is The Main Idea And Rules Of The System .
Now It Is Time To Talk About Frame 1h&4h
Generally We Will Watch The Candels Postion From 55 Sma On Frame 1h&4h
If We Have Buy Signal On Frame 15m We Will Have 2 Cases On Frame 1h&4h
Case 1
The Candels Above 55 Sma This Mean That The General Trend Is Also Up On The Large Frams
Case 2
The Candels Below 55 Sma Here The Candels Must Far From 55 Sma On Frame 1h&4h Not Less Than 50 Pips
 
 
  • Post #19
  • Quote
  • Dec 19, 2007 6:34am Dec 19, 2007 6:34am
  •  hisham_gho
  • | Joined Apr 2006 | Status: Member | 24 Posts
I'm Waiting For Ur Reply Before We Going To Numerical Analysis .
 
 
  • Post #20
  • Quote
  • Dec 19, 2007 10:17am Dec 19, 2007 10:17am
  •  linuxstorm
  • | Joined Apr 2007 | Status: Member | 2 Posts
great system from my forex teacher

go ahead
 
 
  • Trading Systems
  • /
  • TRENDY SYSTEM
  • Reply to Thread
    • Page 1 2
    • Page 1 2
0 traders viewing now
  • More
Top of Page
  • Facebook
  • Twitter
About FF
  • Mission
  • Products
  • User Guide
  • Media Kit
  • Blog
  • Contact
FF Products
  • Forums
  • Trades
  • Calendar
  • News
  • Market
  • Brokers
  • Trade Explorer
FF Website
  • Homepage
  • Search
  • Members
  • Report a Bug
Follow FF
  • Facebook
  • Twitter

FF Sister Sites:

  • Metals Mine
  • Energy EXCH
  • Crypto Craft

Forex Factory® is a brand of Fair Economy, Inc.

Terms of Service / ©2022