EURUSD Weekly Technical Outlook
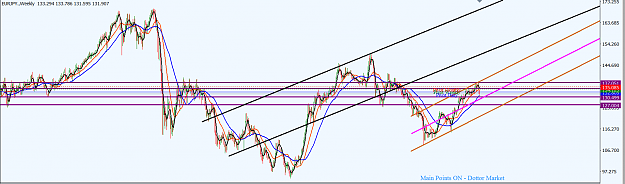
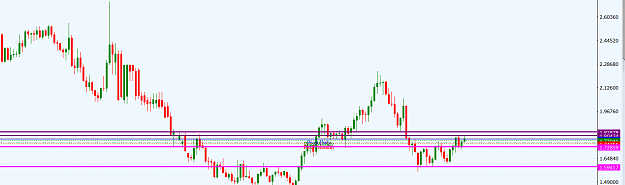
In January 2018, price action on EURUSD entered a resistance zone (1.22550/1.25790) it last trasversed southward in December 2014. Last month’s candlestick printed bullish but with wicks at both ends; indicating that bulls were facing strong bearish resistance. Apparently, we are likely to be seeing some ranging operation of price action in the zone for quite a while.
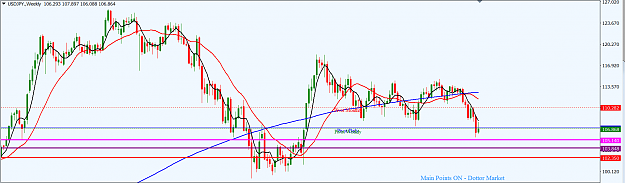
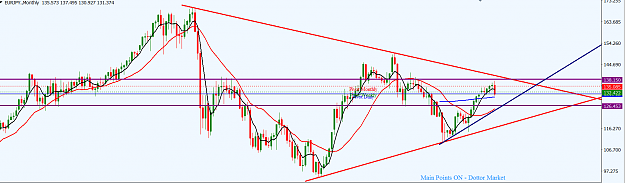
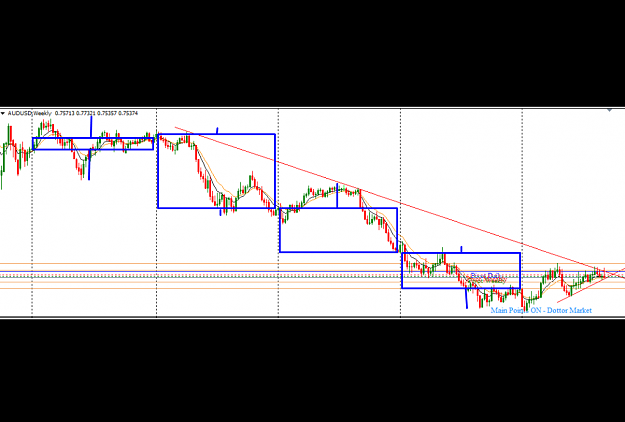
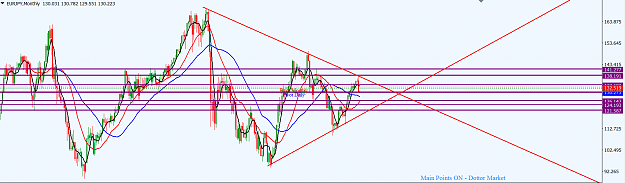
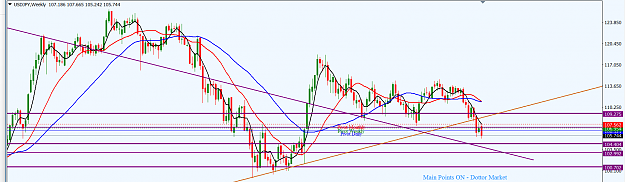
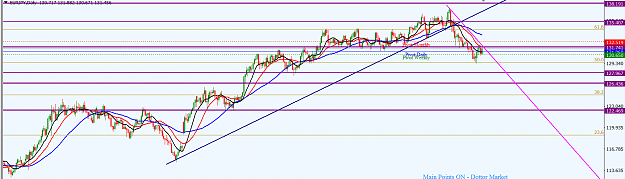
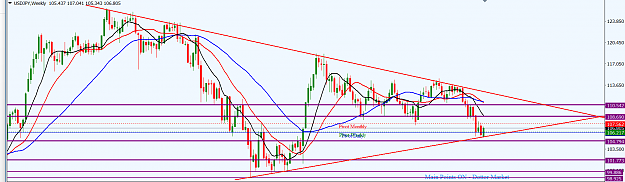
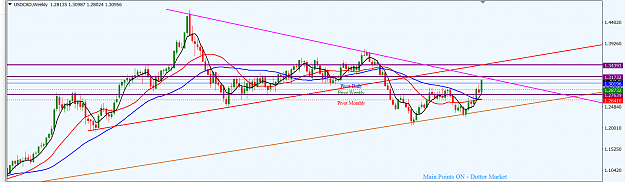
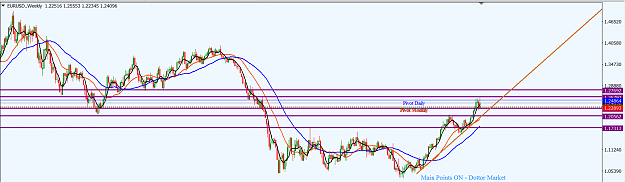
On the weekly time frame, price action has been ranging around the 1.22290/1.25420 area for four weeks. As price action has found it difficult to break above the resistance zone, it is likely that we see an attempt by the market to bear southward and regroup for another onslaught on the zone. Last week, an inverted hammer-like candlestick was formed around the zone; which portends the likelihood of a bearish follow through of price action in the days ahead. An ascending trendline (chocolate) from the low of April 2017 is still very much in play and bears may target a retest of the trendline. Such a move southward is likely to expose the horizontal support around the 1.20500 area. However, should bears fail to break down the trendline, bulls are likely to seize the initiative to turn around price action northward.
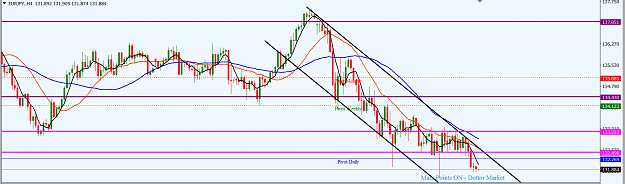
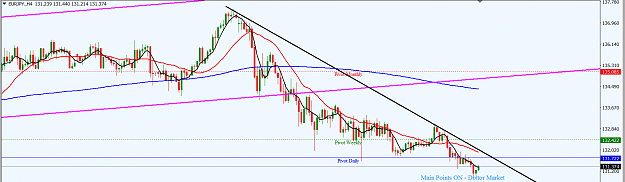
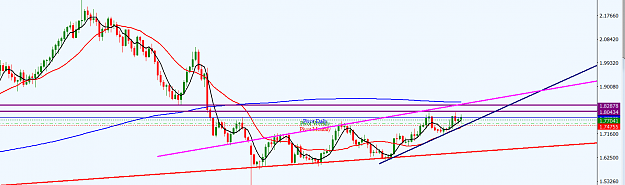
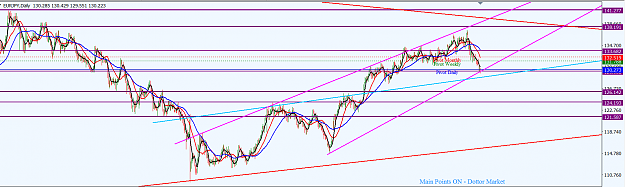
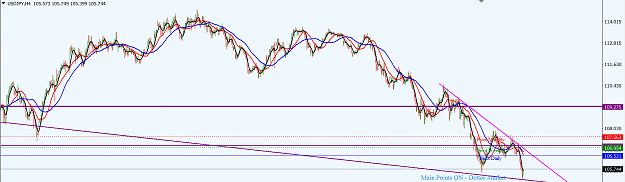
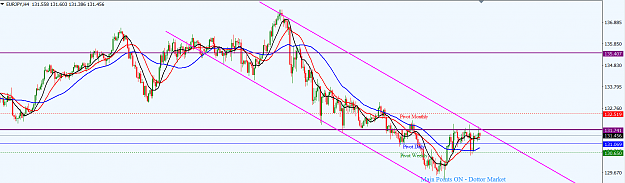
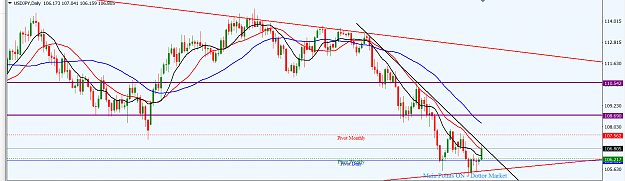
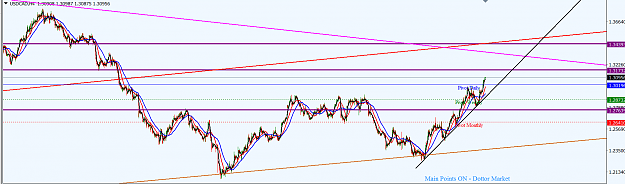
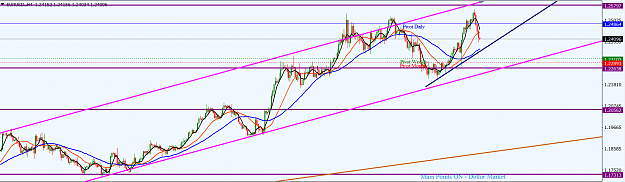
On the H4 time frame, price action has been consolidating in an ascending channel (magenta) for quite a while. Recent price action is bearing southward from the channel rresistance area. An initial target of bears is the channel support or the horizontal support around the 1.22630 area. However, a micro-support trendline (navy) formed by recent price action may be a barrier for a southward move. So, should bears fail to clear this barrier, we may see bulls turn price action northward toward the channel resistance, perhaps to relaunch an attack on the 1.25790 area.
I may be wrong. Trade safe and prosper.
KP
In January 2018, price action on EURUSD entered a resistance zone (1.22550/1.25790) it last trasversed southward in December 2014. Last month’s candlestick printed bullish but with wicks at both ends; indicating that bulls were facing strong bearish resistance. Apparently, we are likely to be seeing some ranging operation of price action in the zone for quite a while.
On the weekly time frame, price action has been ranging around the 1.22290/1.25420 area for four weeks. As price action has found it difficult to break above the resistance zone, it is likely that we see an attempt by the market to bear southward and regroup for another onslaught on the zone. Last week, an inverted hammer-like candlestick was formed around the zone; which portends the likelihood of a bearish follow through of price action in the days ahead. An ascending trendline (chocolate) from the low of April 2017 is still very much in play and bears may target a retest of the trendline. Such a move southward is likely to expose the horizontal support around the 1.20500 area. However, should bears fail to break down the trendline, bulls are likely to seize the initiative to turn around price action northward.
Attached Image (click to enlarge)
On the H4 time frame, price action has been consolidating in an ascending channel (magenta) for quite a while. Recent price action is bearing southward from the channel rresistance area. An initial target of bears is the channel support or the horizontal support around the 1.22630 area. However, a micro-support trendline (navy) formed by recent price action may be a barrier for a southward move. So, should bears fail to clear this barrier, we may see bulls turn price action northward toward the channel resistance, perhaps to relaunch an attack on the 1.25790 area.
Attached Image (click to enlarge)
I may be wrong. Trade safe and prosper.
KP
Do your homework, follow the footprints of smart money