Netflix Inc.: technical analysis 22.08.2022
Good afternoon, dear forum visitors!
NPBFX offers the latest release of analytics on Netflix Inc. for a better understanding of the current market situation and more efficient trading.
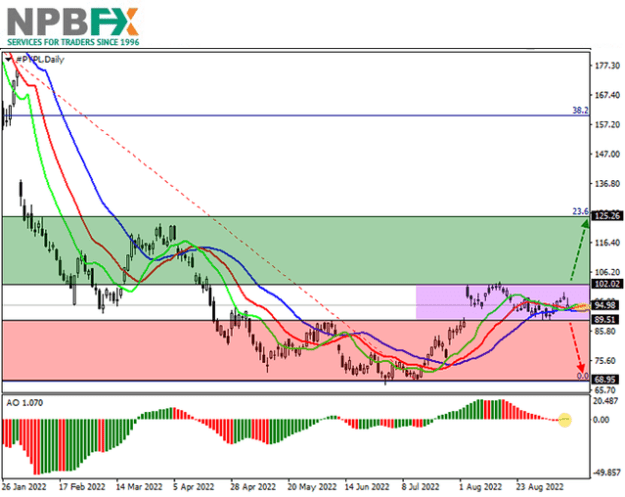
The shares of Netflix Inc., an American entertainment company, are on a corrective trend at 241.00.
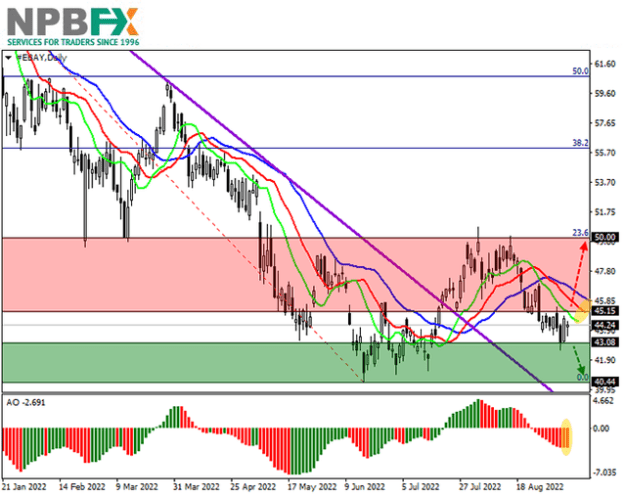
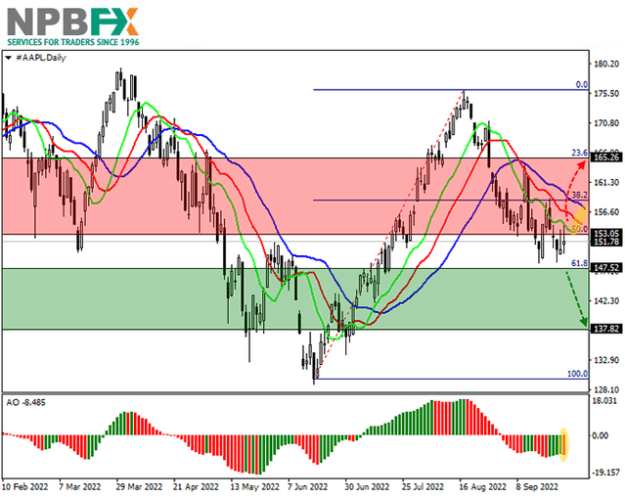
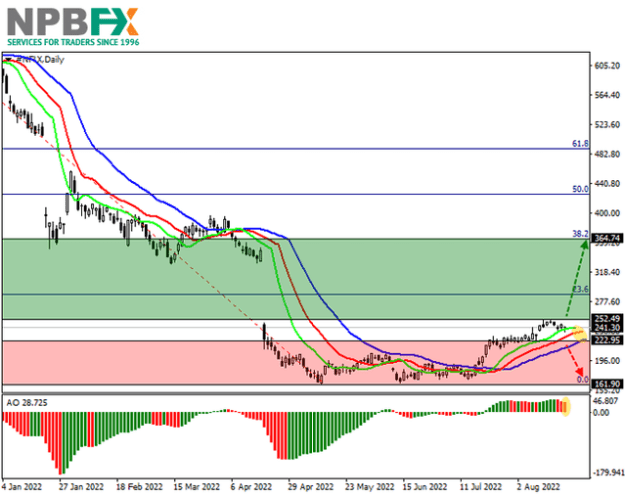
On the daily chart of the asset, the price continues a poor upward trend, trying to close the price gap from April 20, located between 250.00 and 350.00.
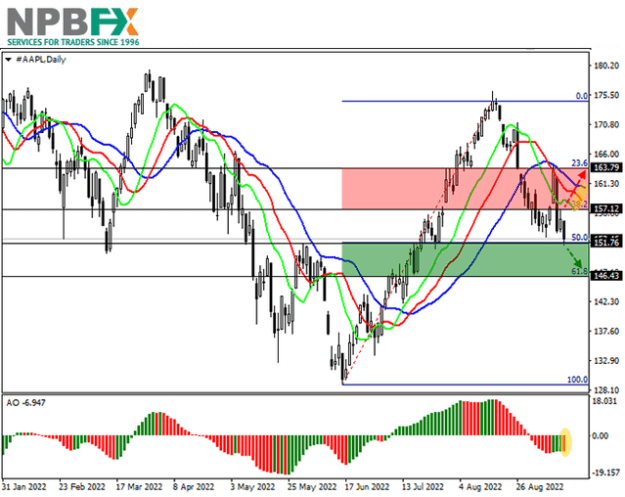
The four-hour chart shows that the potential for an upward movement is quite high, and the key factor may be the consolidation of quotes above the initial correction of 23.6% Fibonacci around 286.00. The closing level of this gap is around 250.00, which is currently being tested by the trading instrument.
Technical indicators keep a buy signal: indicator Alligator's EMA oscillation range expands upwards, and the histogram of the AO oscillator forms multidirectional bars in the buying zone.
Trading tips
Long positions may be opened after the price rises and consolidates above 252.00 with the target at 364.00. Stop loss – 220.00. Implementation period: 7 days or more.
Short positions may be opened after a reversal, decrease, and consolidation of the price of 222.00 with the target at 162.00. Stop loss – 240.00.
Use more opportunities of the NPBFX analytical portal: analytics
You can find more actual analytical reviews on other popular currency pairs, metals and CFDs on the NPBFX online portal. Daily analytics with charts, current market prognoses and trading scenarios in the Feed section are available. Get free and unlimited access to the online portal after registering on the official website of NPBFX Company.
If you have any questions about trading instruments, you can always ask an analyst in the online chat on the portal and get a free consultation of an experienced specialist.
Use the current recommendations of analysts on Netflix Inc. and trade efficiently with NPBFX.
Good afternoon, dear forum visitors!
NPBFX offers the latest release of analytics on Netflix Inc. for a better understanding of the current market situation and more efficient trading.
The shares of Netflix Inc., an American entertainment company, are on a corrective trend at 241.00.
On the daily chart of the asset, the price continues a poor upward trend, trying to close the price gap from April 20, located between 250.00 and 350.00.
The four-hour chart shows that the potential for an upward movement is quite high, and the key factor may be the consolidation of quotes above the initial correction of 23.6% Fibonacci around 286.00. The closing level of this gap is around 250.00, which is currently being tested by the trading instrument.
Technical indicators keep a buy signal: indicator Alligator's EMA oscillation range expands upwards, and the histogram of the AO oscillator forms multidirectional bars in the buying zone.
Attached Image (click to enlarge)
Trading tips
Long positions may be opened after the price rises and consolidates above 252.00 with the target at 364.00. Stop loss – 220.00. Implementation period: 7 days or more.
Short positions may be opened after a reversal, decrease, and consolidation of the price of 222.00 with the target at 162.00. Stop loss – 240.00.
Use more opportunities of the NPBFX analytical portal: analytics
You can find more actual analytical reviews on other popular currency pairs, metals and CFDs on the NPBFX online portal. Daily analytics with charts, current market prognoses and trading scenarios in the Feed section are available. Get free and unlimited access to the online portal after registering on the official website of NPBFX Company.
If you have any questions about trading instruments, you can always ask an analyst in the online chat on the portal and get a free consultation of an experienced specialist.
Use the current recommendations of analysts on Netflix Inc. and trade efficiently with NPBFX.