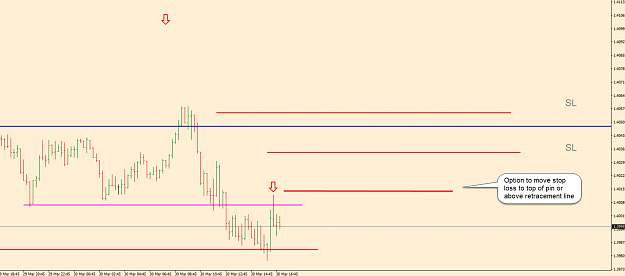
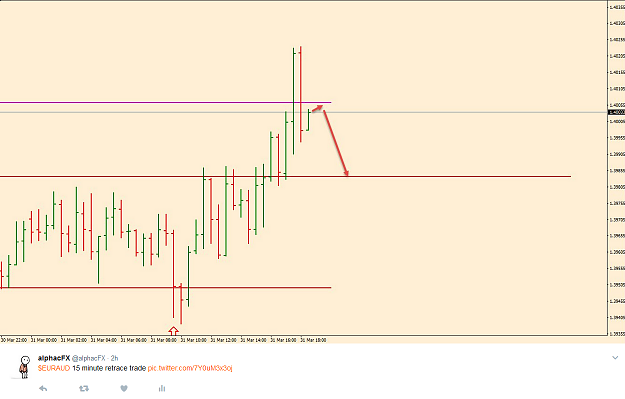
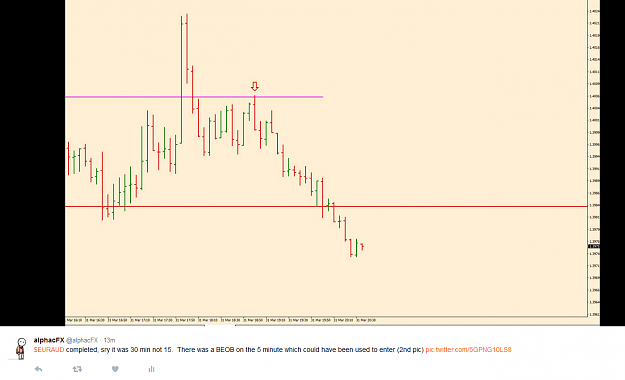
EURAUD update to Post #378. After the price broke the low of the BEOB it reached the FTA (a red line on this chart) and pulled back to where you'd expect and there was a 15 minute pinbar.
EURAUD 15 minute chart.
Attached Image (click to enlarge)
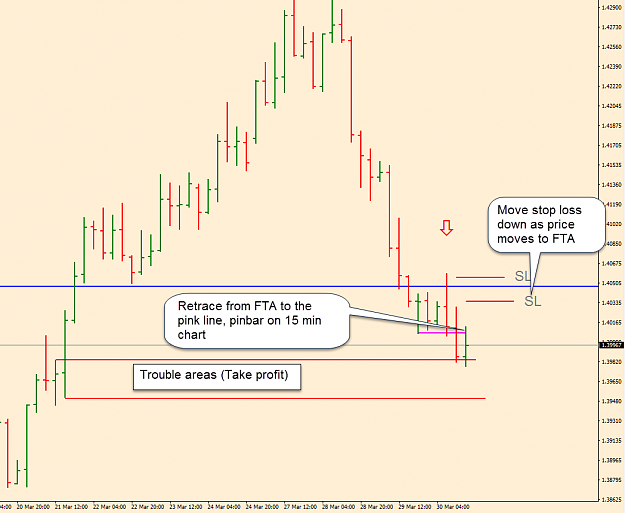
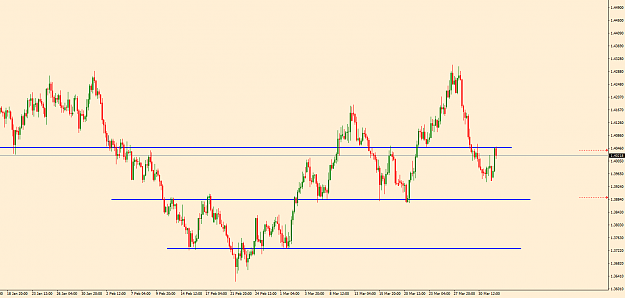
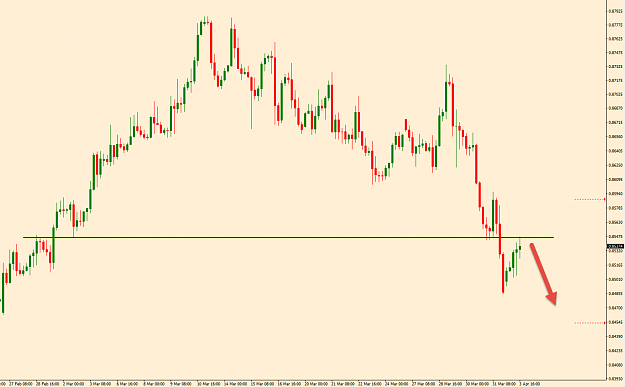
EURAUD 4 hour chart for fuller picture.
Attached Image (click to enlarge)
You now have the option to use a tighter stop loss at a place that makes sense and gives you a much larger R:R.
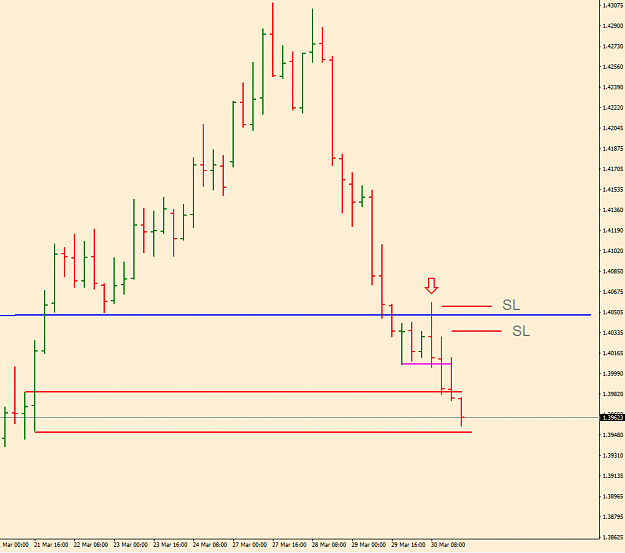
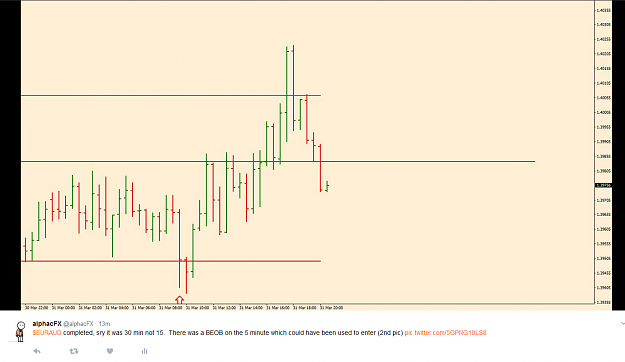
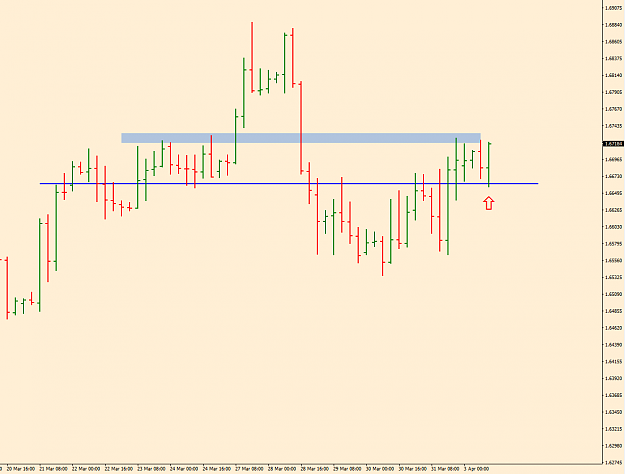
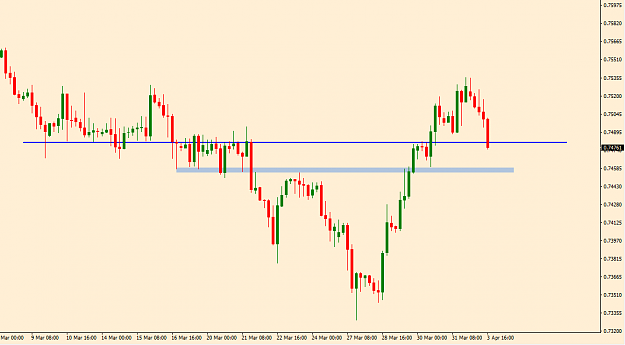
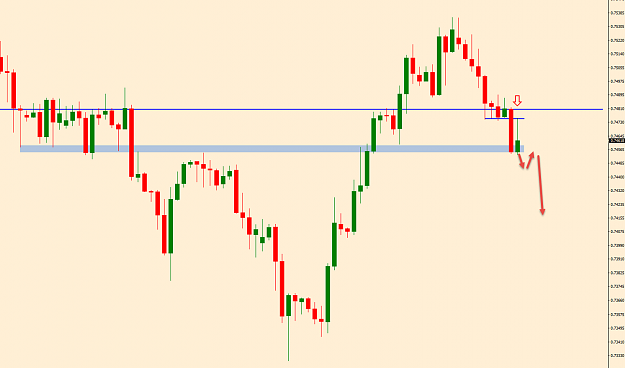
EURAUD second follow up. Price was held between the two red lines and a BUOB/pinbar formed, it closed just under the top line then retraced some, the way to enter would have been on the break of the top of the bar, you're then the right side of the PPZ, you could then use the retracement line (the pink one as your target) I didn't take it. Look at the 15 minute to see better how the lines held price, don't underestimate these simple lines, anyone can draw them, why they don't is a mystery to me, the simplist method there is and so few seem to use it or want to make it more complicated.
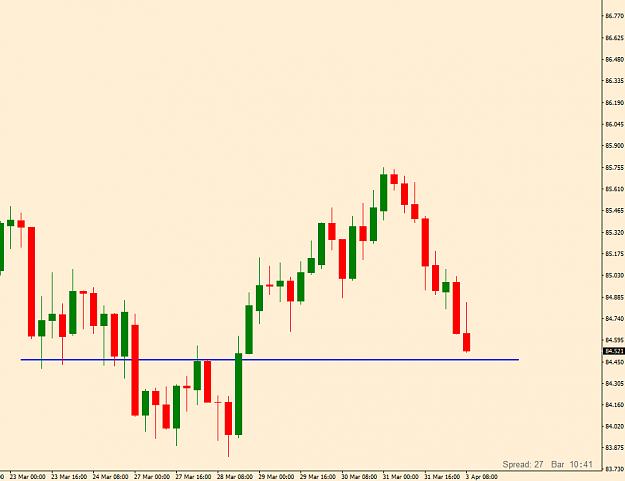
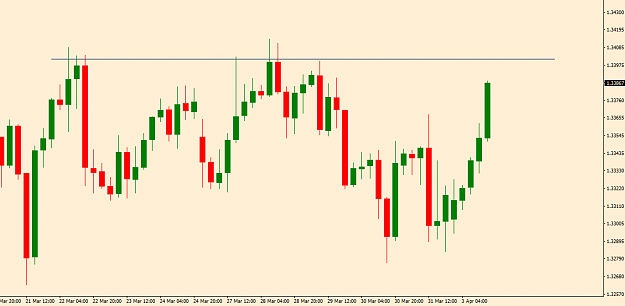
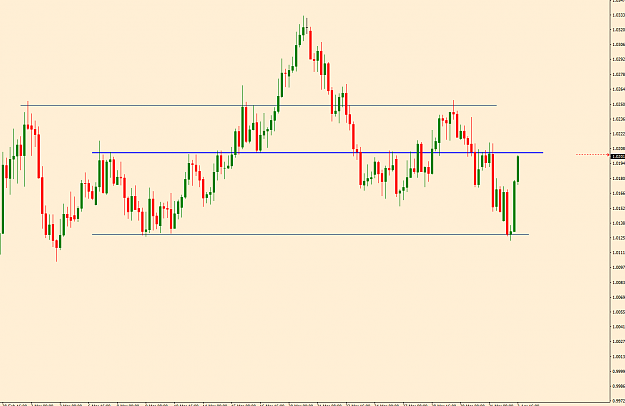
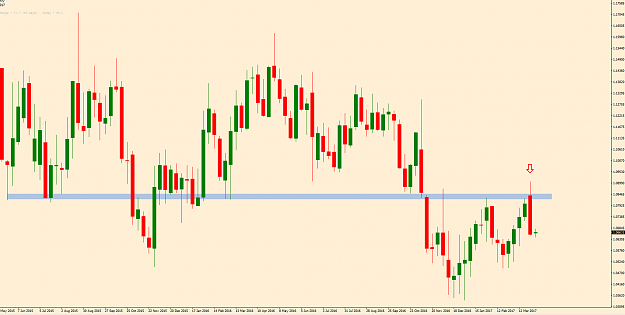
CADCHF 4 Hour chart. BUOB continuation trade, off of one flip zone and through another, you now have both of these behind you, what's not to like? Why aren't you trading these? Could have entered at close of bar, there was also a retrace to the top line, in this case there would be no need to wait for it.
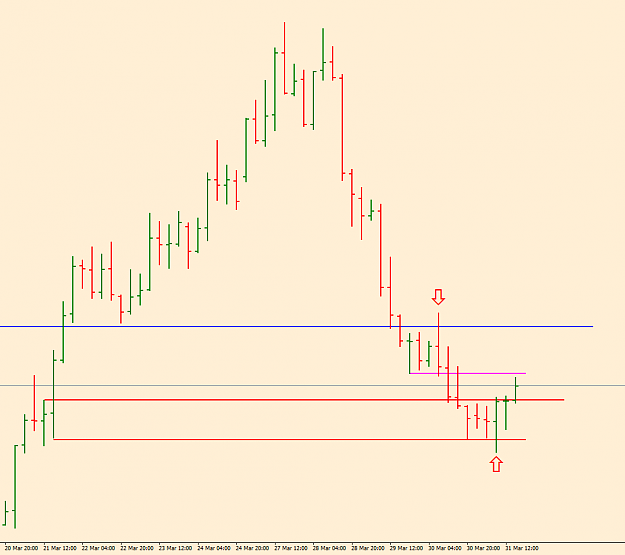
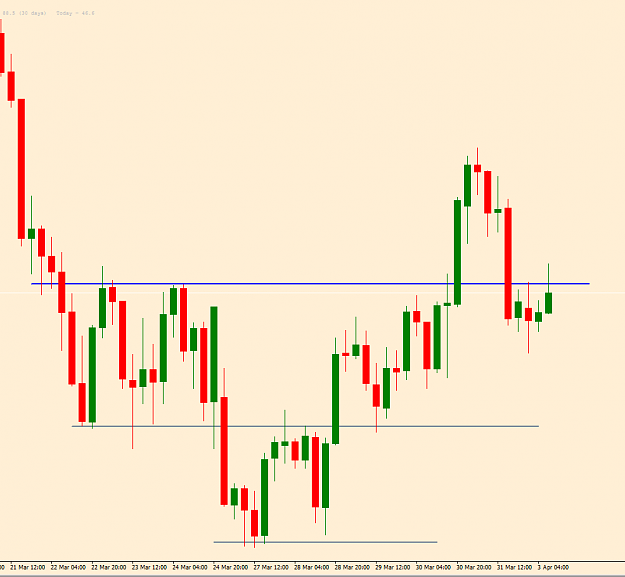
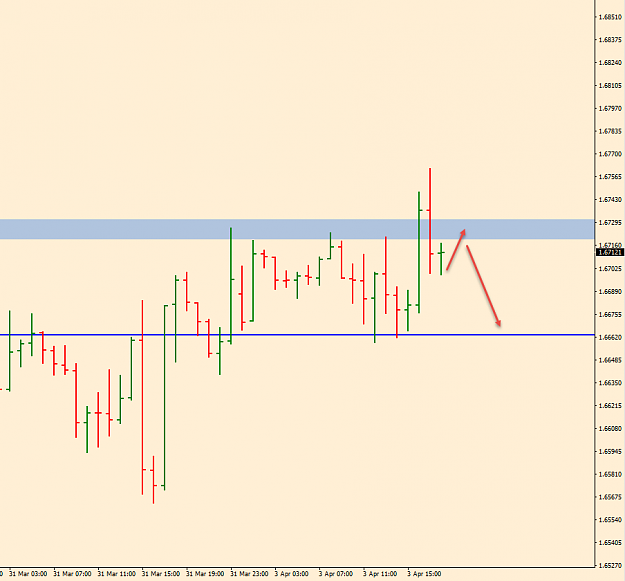
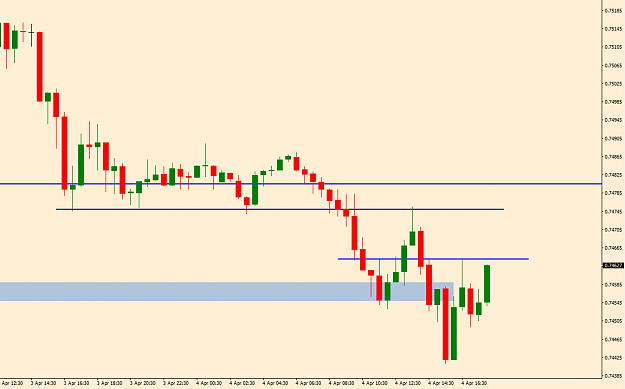
EURAUD 30 minute chart, 2 bar pinbar at the pink retracement line (PPZ) see location on Post #384. Closed quite close to the target, good reason to take a retrace trade, small stop loss above the PPZ either way.
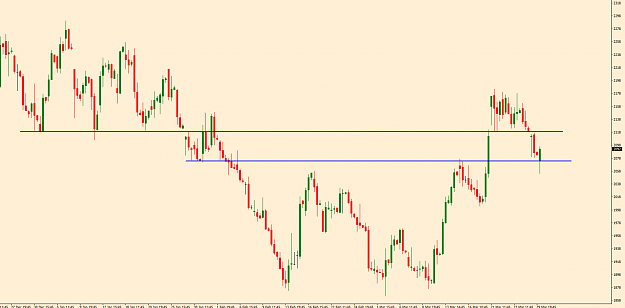
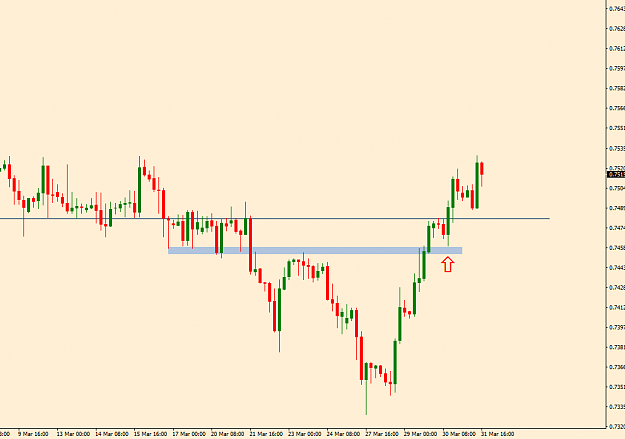
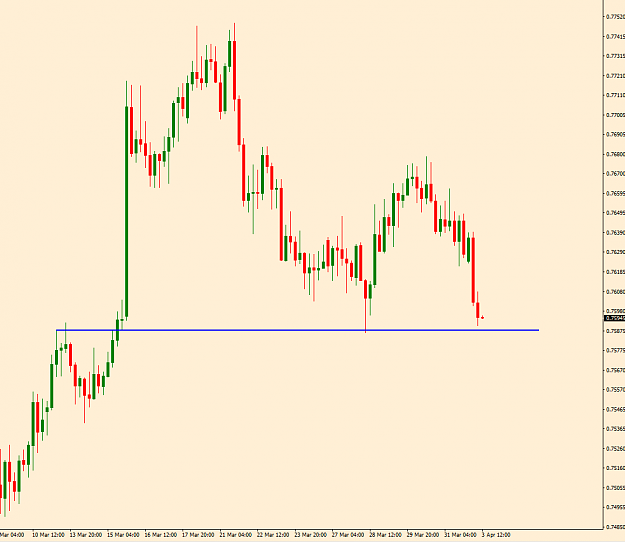
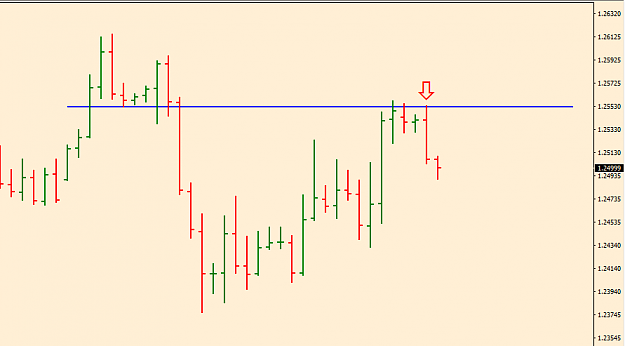
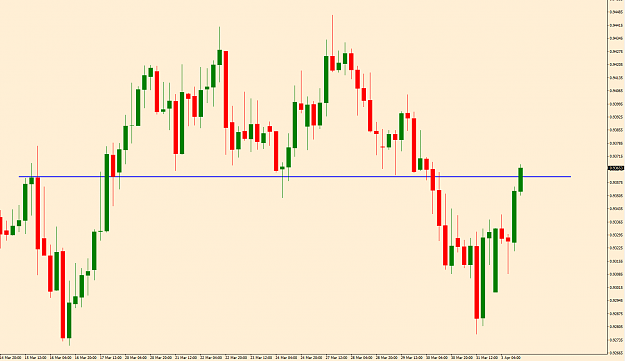
CADCHF 4 Hour chart. Looking for a close under the PPZ (blue rectangle) after pullback to a support area. Another pullback to the PPZ and some PA would be the ideal situation.