Hello,
I'm starting this thread to see if there are any traders in this community who are able to or have created a spread chart. A chart which in this case would be used in a spreading strategy. As spreads have two different meanings in Futures and Forex what I mean by that is a line chart that show the price differentials between two separate pairs, which then shows in one line when one pair outperforms it's counterpart.
So for example in the thread "Hedge and Correlation Strategy" by Dreamliner ( http://www.forexfactory.com/showthread.php?t=160912 ) they have created a visible difference and correlation in bar charts.
If you have never traded spreads in futures, something that I am quite new to as well. Spreads can take much of the risk out of trading, and a boat load of stress too. If there were more spread charts to trade off in forex I'm sure at least a few problem trades could be avoided.
Let me show you what I mean:
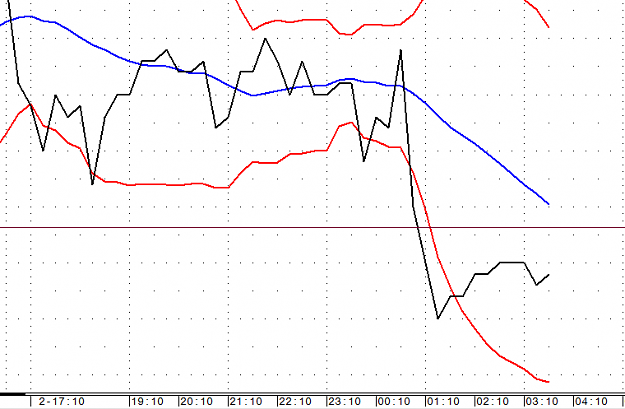
Here you can see the spread, or the price differential between two products. There is a slow leg and a fast leg, and you calculate the spread off the slow leg.
Now if the price of the slow leg is under performing against the fast leg the line goes down and you can short the slow leg and long the fast leg. Or the opposite way around would be if the line on the spread chart is going up, it means the slow leg is outperforming the fast leg, and you should long the slow and short the fast.
It's also fantastic for outright trades at the same time.
If anyone has had any experience with this or has an idea how to make it in forex, please comment. It will be very much appreciated.
I'm starting this thread to see if there are any traders in this community who are able to or have created a spread chart. A chart which in this case would be used in a spreading strategy. As spreads have two different meanings in Futures and Forex what I mean by that is a line chart that show the price differentials between two separate pairs, which then shows in one line when one pair outperforms it's counterpart.
So for example in the thread "Hedge and Correlation Strategy" by Dreamliner ( http://www.forexfactory.com/showthread.php?t=160912 ) they have created a visible difference and correlation in bar charts.
If you have never traded spreads in futures, something that I am quite new to as well. Spreads can take much of the risk out of trading, and a boat load of stress too. If there were more spread charts to trade off in forex I'm sure at least a few problem trades could be avoided.
Let me show you what I mean:
Attached Image (click to enlarge)
Here you can see the spread, or the price differential between two products. There is a slow leg and a fast leg, and you calculate the spread off the slow leg.
Now if the price of the slow leg is under performing against the fast leg the line goes down and you can short the slow leg and long the fast leg. Or the opposite way around would be if the line on the spread chart is going up, it means the slow leg is outperforming the fast leg, and you should long the slow and short the fast.
It's also fantastic for outright trades at the same time.
If anyone has had any experience with this or has an idea how to make it in forex, please comment. It will be very much appreciated.