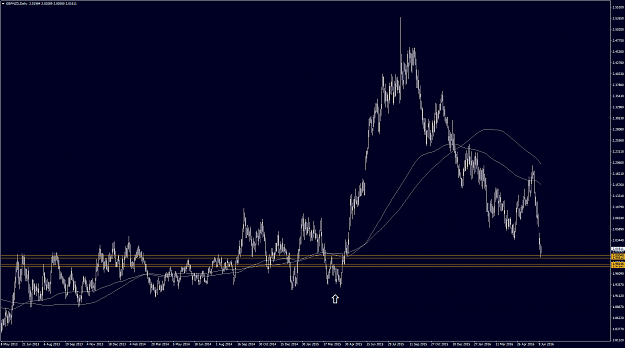
GBPNZD Hello traders, what do you think ? In W1 looks overbought, watch tl {image} H4 its ranging inside the fork, so what...? {image} HPT
Ignored
I don't pay all that much attention to this pair, but price is coming down a bit strong and the range that it is entering is long, which means several possible golden level candidates (harder to pick one). As you can see, the upper level @ 2.000 is causing a price reaction, however there is another good level right below it.
{quote} EURJPY: I see 122 is a major level for this pair coming from 2008, 2010, 2011, 2013 - please see weekly chart below. And it's exactly Fib-50 from last weekly leg up. It's broken recently (might be false broken). Since it's a very important level we may see some range with multiple retests of this level as resistance, so it may be a good GL candidate to go short. Murrey median 4/8 level on H4 chart is here too for confluence. Quinton, I suggested already to create a separate dedicated thread for each pair which deserves our attention, so...
Ignored
The run up back into the range was very scalpable for shorts (as I posted), however the intermediate volatility made positioning a longer-term short before the fall tricky. Price is curving down parabolically and entering territory it hasn't seen in years. Will mine for some golden levels in those longer-term ranges going back a few years.
{quote} GBPUSD always the same, have to open my eyes its all on the chart, - closed my trade to early could be much more draw tls and look @ significant points, example - crossings - and highs/lows . here the chocolate areas. Then use fib and ...., simple but its working - perfect tp {image} make your own decision
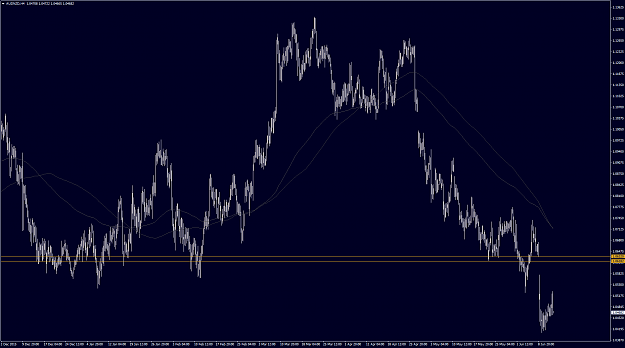
AUD/USD Just a heads up= Diverging a bit from GL agenda, but still relevant to PA, AUD has formed a doji on weekly, which could become a bearish evening doji star if confirmed by follow up bear candle, portending a drop at weekly level {image}
Ignored
The retracement was good for about 50 pips.
Time to dig for levels deeper within that cup that price is charging toward. The red ones in the chart below were generated by an indicator that I will be releasing hopefully shortly.
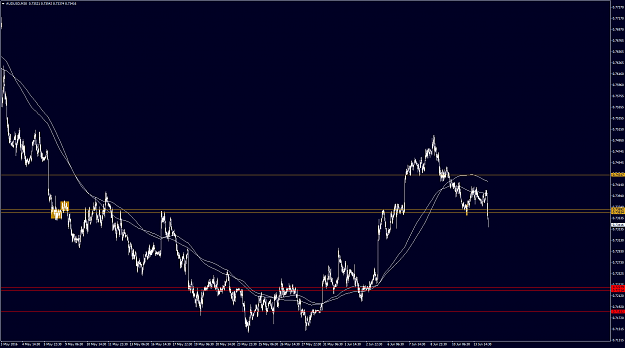
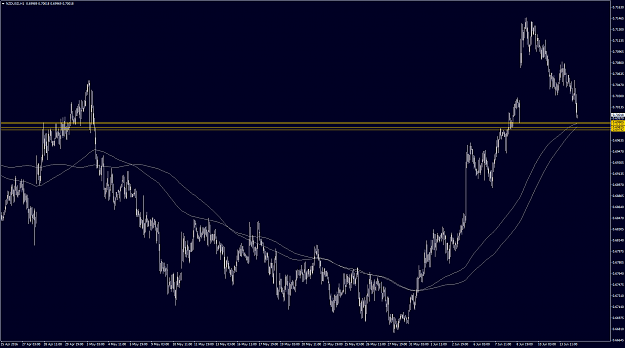
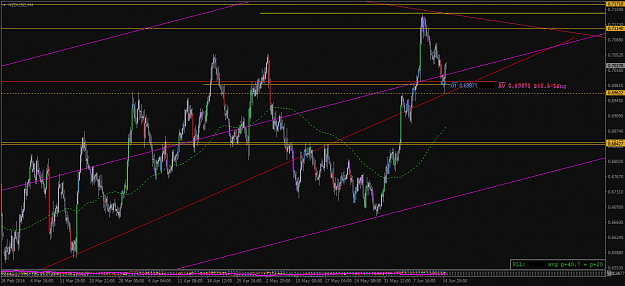
AUD/NZD Retracing from underneath the broken GL.....setting up for possible short, 200 MAS are above GL {image}
Ignored
Would usually not take a short from a golden level that was meant for a long, unless PA is stacking cleaning in a clear trend. But it seems to be reacting.
How does one use the goldenalert ? I've added it to the indicators folder and drag it onto a chart but nothing. Does one place a horizontal line and somehow associate it with the goldenindicator through the description dialog? Thanks in advance
Ignored
The indicator should detect the the line automatically. Did you set the Pip alert value? I will probably update it with some refinements after the golden level "detector" indicator is released.
{quote} Brent Crude I've drawn in a different TL on 4HR and cleared others for clean picture. This one comes from low of mid Feb. The grey and red lines that wrap around it almost constantly on the way up are the 200 EMA and 200 MA. I've found a candidate for a GL at 48.78-48.88 that has confluence with the trendline and MA levels, which are currently within 3 points of each other at 4868 and 4865. Quinton thanks for the update on CAD/USD I will use your top GL for TP, I had my pending triggered yesterday at 1.2772. Good call on AUD as well, I didn't...
Ignored
A good TL and MA 200 can be enough to cause a bounce. However, I consider oil to require more PA confirmation much like a stock. In fact, most of the candle patterns come from the stock and commodities world where price momentum can be much greater than in FX (on average) and price revisions tend to be less likely.
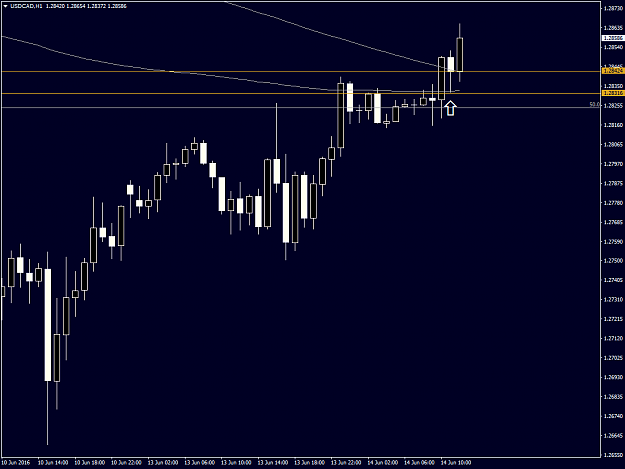
As for USD/CAD it was pretty clear to me that price would likely push through that first level, what happened after is a good example of a golden level destined for a short flipping into a long entry target. Price is trending strongly and "stacking" as the level changed from resistance to support. In fact, even the same MA acted as confl. for the long and hit it and the level to the pip. All the action played out short-term and personally I do not think that the time spent monitoring this short-term action would have been worth it. But it's a good example nevertheless.
Attached Image (click to enlarge)
As for brent vs. crude, there is a technical difference over the short to mid-term much like with the JPY crosses or the various equity indices. Over time there tends to be strong correlation but when it comes to entries and price targets, the technical differences make all the difference.
Both H1 200 MAs are coming together to provide confl. support to a level right below .7000. (within 10-20 pips). The level is not the absolute highest quality, however it exists right below the round numbered level allowing for a long when/if an overshoot of .7000 occurs. USD news is coming up within a few hours so I will likely not take a trade ahead of it unless price moves to the level within the next minutes. Even then it would only be good for a short scalp.
|
Joined Jun 2015
|
Status: They see it, still don't believe it
|28 Posts
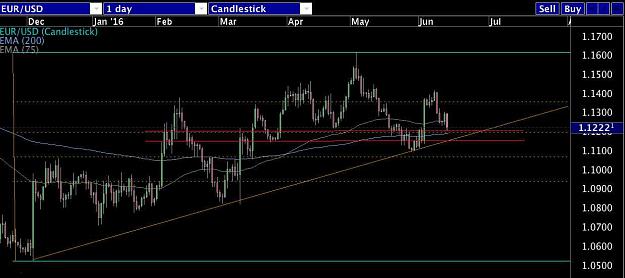
EUR/USD almost @ round number 1.1200 coinciding with MA 200, 0.38 fib and the ascending TL on the Daily.
However, it doesn't look deeply oversold right now so I'm also considering a lower level for a long if it comes into play (1.1180-1.1150) Low leverage and scale in if/when it takes off.
{quote} The indicator should detect the the line automatically. Did you set the Pip alert value? I will probably update it with some refinements after the golden level "detector" indicator is released. Q
Ignored
I see!
So, it automatically triggers any line on the chart when price comes to it (within set range).
EUR/USD almost @ round number 1.1200 coinciding with MA 200, 0.38 fib and the ascending TL on the Daily. However, it doesn't look deeply oversold right now so I'm also considering a lower level for a long if it comes into play (1.1180-1.1150) Low leverage and scale in if/when it takes off. {image}
Ignored
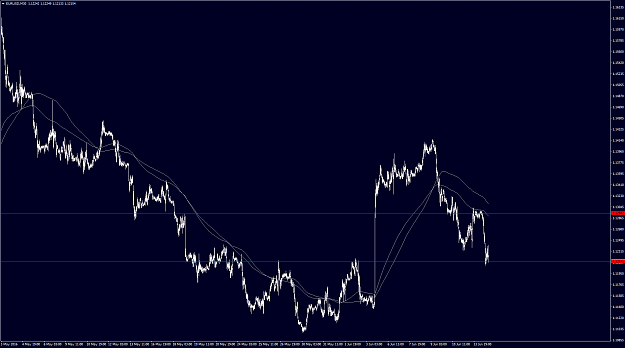
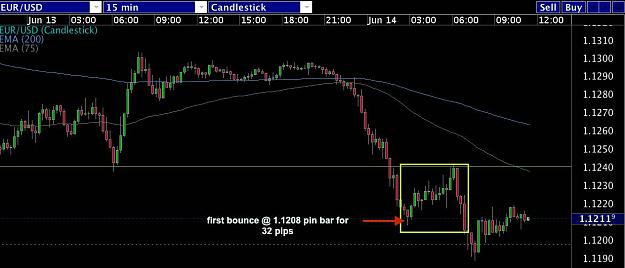
Absolutely. I've been testing the indicator which mined a level @ 1.1214 that was defined by the recent cup. But more than the 20 pip bounce I would not expect due to the reasons you already mentioned.
Attached Image (click to enlarge)
Interestingly on the M15, the indicator produced a level @ 1.1156.
EUR/USD almost @ round number 1.1200 coinciding with MA 200, 0.38 fib and the ascending TL on the Daily. However, it doesn't look deeply oversold right now so I'm also considering a lower level for a long if it comes into play (1.1180-1.1150) Low leverage and scale in if/when it takes off. {image}
Ignored
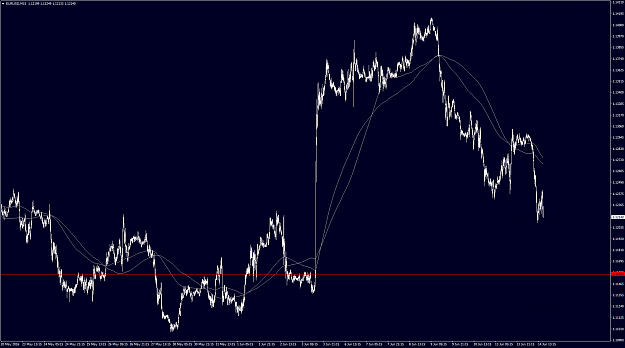
Did a fun golden level "heat map" which produced the top 30 levels with 3 pips difference between highs and lows. Price is right at a cluster of these. The largest within the long-term range. Still I agree that it would be wise to go long at a better priced level due to PA.
{quote} Did a fun golden level "heat map" which produced the top 30 levels with 3 pips difference between highs and lows. Price is right at a cluster of these. The largest within the long-term range. Still I agree that it would be wise to go long at a better priced level due to PA. {image}
Ignored
Thanks Quinton for that level indicator you've been working on !
Yes, that May cup showed a level slightly higher than the 1.1200 round number. In fact, the first fresh bounce was from 1.1208 and produced a 32 pip move. Since (like the heat map shows) we have a cluster of levels in that area, I opted for the 1.1200 round number as my first support level to start considering a light positioned long. But my plan is to also consider the lower levels I mentioned and scale in.
I think it's also important to keep in mind the upcoming British Referendum and tread lightly for now. The rumor is that England will stay within the EU.. we'll see.
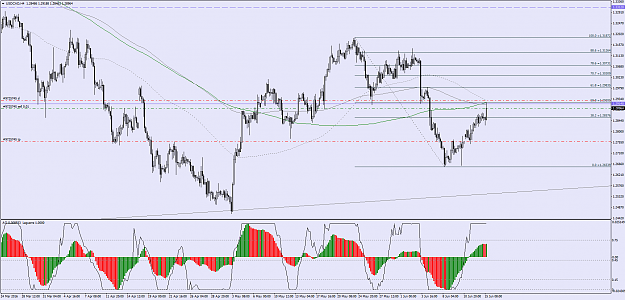
{quote} USD/CAD Here are the next levels to consider for shorts. Price definitely has some bullish ambitions in the near future but is re-entering the recent range that it just poked out of. PA is definately too bullish to consider the lower level for anything but a scalp (and even that is questionable) The upper level right above 1.2900 has multiple fib retracement confl. and possible higher TF H4 200 MA resistance. It also is formed by thicker price knots and a series of significant lows. If price progresses as is has been, by the time it gets...
Ignored
Locked in BE on this one. Fib 50 last leg + MA200 was there now. SO lets see . Can become a nice runner at fomc day .