Disliked{quote} Hi factlover, Did not monitor this one, but I do not see a golden level at 166.70. The highs of that fairly dense range caused a reaction for now. {image}Ignored
I see a possible confluence with old descending weekly channel which started in 2013 when the current weekly downtrend began - dash-dotted lines on my weekly chart below.
And weekly Fib-61.8 is right at the yesterday's low for another confluence - it's one of your major Fib levels for GL.
I missed that nice GL level at 115.50 area but got some pips in today's rally from yesterday's 116.70-117 level
Attached Image (click to enlarge)
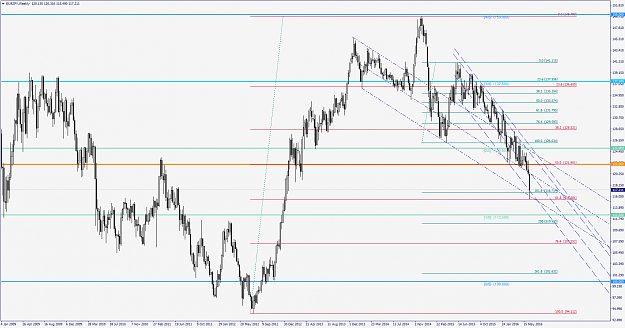
upd: yet another channel comes from daily chart - please see blue dashed lines on the chart below. And yesterday's low was on its border...
Attached Image (click to enlarge)
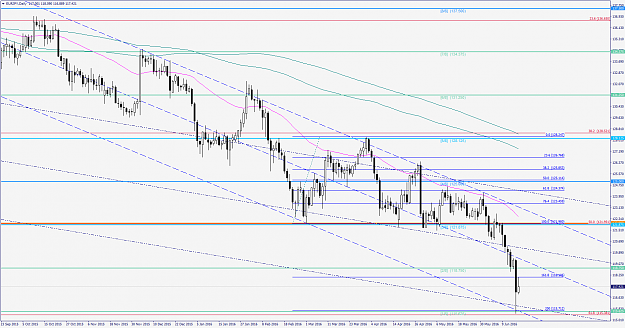
upd2: another Fib confluence and possible item for a mining check list in twilight zones like the current one in EJ pair.
Golden mining is about searching for good turning points so any possible clue about market movers key levels might be useful.
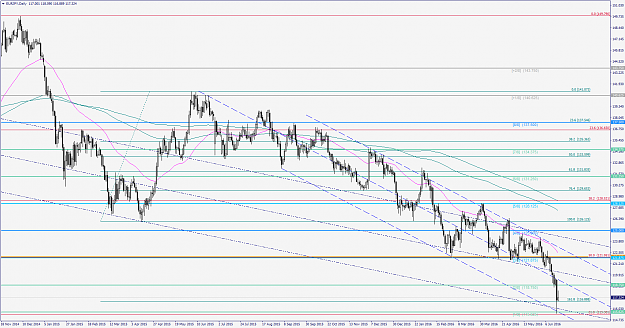
I see the last reversal at 115.50 was around Fib-200 extension from the last leg up before breaking the major level at 122 (weekly Fib-50 etc.) - see blue Fib levels on chart below. And that is naturally in line with Murrey levels: 2 M-levels leg up and now 2 M-levels move down after the break.
Note that the last quick retrace was to Fib-161.8 (118.10) on that scale
Attached Image (click to enlarge)