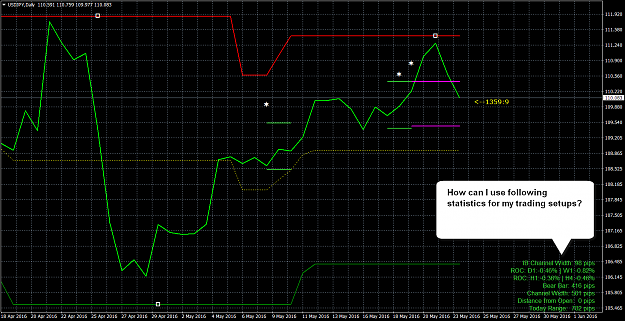
DislikedBe aware of the possible impact on small quantum trading ranges and the movement of price from Quantum signal box to closure of trade. Price can and will move quite a distance over a 5 minute TF as shown below (taken from my live QAm account) which can cut potential profit. {image} When the ranges are very tight a profitable trade may reduce in profit or actually turn into a loss. Note: it can also work the other way too making closure of trades more profitable in the case where price eventually closes many pips away from where the Quantum closure...Ignored
I have gone through each and every post of yours and thanks to you I realised what mistakes I was making.
In spite of making good profits I never took profits on cycle basis and was therefore stuck on days when I could not trade anymore because of FIFO rule and trying to control margin calls.
Cycle trading/Equity trend trading opened my eyes and in spite of three times the account showing 10% increase in a month in different weeks I was only looking at the profitability of each trade and felt helpless in not being able to trade any more for fear of margin calls or avoiding overtrading.
I am a 67 year old discretionary trader now teaching free of cost as a communitu service housewives and retirees with substantial savings to trade fx spot and fx options. Unfortunately, I don't have any skills in Excel or coding though I have learned to understand by practice and study how Excel sheets, Indicators, EAs, Apps margin/position/pip calculators can work as my trading assistants.
I only believe in signals transmitted by my brain and I use EAs only as data crunching aids. I want to have simple indicators and clutter-free chart for my brain to function smoothly and fearlessly.
I don't use any kind of TA indicators except Moving Averages Distance to determine trend, pullbacks, retracements and reversals. I am fond of using boxes for drawing ADR lines, using small TFs in large Time frames like GGbox (similar to M candle and other so many such indicators).
I keep looking for seasonal patterns (particularly for oil consumption for CAD trading) and fortnightly, monthly, quarterly changes (thinking that after all they need to have profits at least every quarter since there is no dividend paid by fx market makers).
Most of what I do is casually and intuitively. I have not put together my trading ways into a system so far.
But after seeing substantial profits and seeing big drawdowns (not affecting my equity in any way) in my account I realise I have to have a system if I have to teach discretionary trading effectively. And luckily I landed onto your thread.
What I do instinctively:
1. Take a direction view based on fundamentals only. I draw a mental map of daily news events and draw a sort of trigger points. If GBP or JPY has three events I will assume one event may take it up, another may bring it back to opening line and third one may even take it down. It always pays off at the end of the day if you are able to judge and do grid/position slicing trading.
2. I don't use stop-loss and instead pile up positions up to 5 slices. I determine the high-low of a month and then determine maintenance margin I will incur if the past pattern repeats. I also keep some more extra margin as buffer to enable me to do scalping.
3. I treat trading as a consumer goods business where I am dealing in only one limited edition item which can appreciate in time and lose value or gain value on a daily basis too.
My limited edition product is GBPJPY. It is always moving and has large ADR. It is sort of a derivative of 14 pairs, all involved in playing a chess game, and pulling each other in opposite directions. It is a challenge managing this fast moving pair but worth its while in terms of trading opportunities and profits. Its difficult to determine what direction it will take on a long-term basis. So I only use it for short-term trading (weekly/monthly position hoping for appreciation) or day trading and particularly scalping because of its momentum speed (making daily profits).
Trend bias is paramount for me and I don't trade during months like December, January when multi-year adjustments are carried out by market makers in Japan and USA to balance their books like any business person will do. I don't see any ulterior motives in this kind of exercise. Spot fx is affected greatly by options and structured products whose data is not available to retail fx traders. Large traders do seem to have access to such data and whether they act in tandem or not is anybody's guess.
I estimate Medium-term trend on the basis of fundamentals, seasonal pattern for CADUSD.
4. For running a business cash flow management is important. I am prepared to sell my goods at breakeven price but not on a loss or mix goods and sell on an average price.
I don't use stoploss and instead average my positions to reduce my breakeven point. Mentally, I am not affected by seeing some stock losing value on a daily basis and am willing to put up with a large drawdown up to 30% of position value. My day trading is not affected until I cross danger point of my account equity. It is at this point I get stuck and if the drawdown continues I feel frustrated at not doing scalping trades. My business practically comes to a halt. Luckily so far no reversal has taken place as to wipe out my equity (except in 2008) or put me in huge loss. Thank God, profits so far have taken care of my living expenses after I started trading in GBPJPY for more than a year.
5. I have been making decent money but now I realise I can't teach this kind of risk trading to anyone. And must make a system and collect proper tools.
Indicator/EAs/scrips I am now looking for are:
1. How to determine drawdown by selecting (a) date which means if I select 15th of a date vertical lines are drawn on each 15th of the month so that I can compare when the reversals A good script has been coded by cyber1 but that is inadequate . http://www.forexfactory.com/showthre...83#post8939083
I am looking for a tool which can draw drawdown trendline by selecting two dates (from time,date,year to time,date,year) and selecting multiple dates up to 10 preferably using just one indicator to identify seasonal trends.
2. Drawing multi-time frame boxes based on volatility (ADR), pips input manually, Moving Average Distance, Fibs. I will use these boxes as point for entry and exit, support and resistance. You have provided a host of good tools. Your 20 pair ADR indicator and Session BO box are good. If the dashboard can print Moving Average Distance as well, it will be another good feature. Pivots+Fibs is also good. Moving Average Distance box drawn based on MA input will be very useful in visualising resistance/support, pullbacks, retracements, reversals, probable profit etc. For actual volatility I use Gumrai Multi Pips dashboard to do top down analysis to estimate medium term trend bias and CJA's Ranges Dashboard extra to keep an eye on ADR exhaustion points.
3. I have learned that Bollinger Bands or Donchian Channels could provide one-point indicator for all my needs. I have yet to come across this kind of strategy being practised from an experienced person like you.
4. For Position trading the way I slice portions to reduce breakeven points do you think Reverse Martingale can help me? The attraction for Reverse Martingale is risk/reward system and the possibility of not having a huge drawdown as a stoploss points. Instead I can slice drawdown into 7 stoploss positions and trade 1+2+4 total 7 trades for better risk reward positions. In theory it looks good. Your advise and any EA can you recommend which can print positions on chart in a table form like profit tracker.
4. I advise my students to choose only Interactive Brokers for lowest commission, spreads and funds security. But I use MT4 to deploy assistants like Indicators, Scripts and EAs and for demo trading. I would like to have some indicators/EA which can provide statistics like FF TA on the chart itself. Similar to iprofit trackers but not based on history. To print on chart drawdown, probably profit based on dummy trades input manually or through EAS.
What I learned from you?
You have exposed me to the equity trend trading.
I will try to practise live on it.
And use Drawdown as stoploss point instead of looking at each trade's movements.
Can you suggest good entry points? I am at present using only MA distance. Fibos: Can they act as overbought or oversold points?
Thank you again for sharing liberally your experience and knowledge.
Practice makes a person perfect