NOTE: I don't visit FF so often now, so don't expect replies to your posts. You can find an index to all my indicators and posts here.
Room Up/Down indicator: Terms and Conditions
All code is supplied FREE of charge. It may NOT be sold or distributed commercially. Unless otherwise shown, no source code is available.
Software is offered on an 'as is' basis. I'm not offering a programming or troubleshooting service.
There is no guarantee that the software is fit for purpose, or free of errors. Download and use the indicator(s) at your own risk; I accept no liability for computer damage or financial losses.
___________________________
Overview
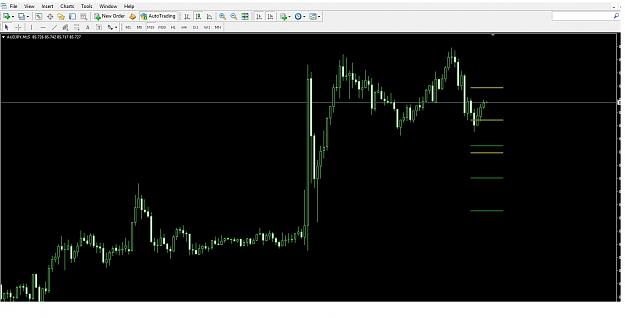
This MT4 indicator operates according to a simple concept. It plots two (sets of) horizontal lines, telling you how far price must move -- up and down -- from the current price, in order for today's range to reach the same number of pips as X% of a N-day ADR. By supplying a series of values for X, you can see how far price is currently away from completing, for example, 50%, 75% or 100% of the average daily range, in both the upward and downward directions. See screenshot below for an illustrated explanation. The plotted levels move dynamically as new daily highs/lows are formed. In the screenshot you can see that, so far today, price has moved around 75% of the ADR, to the upside of the daily low. 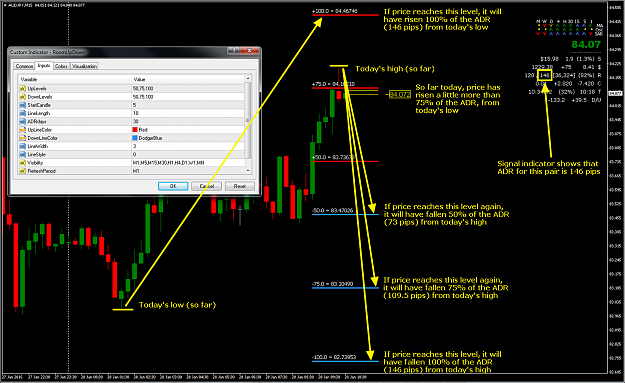
In the context of a trading strategy, after price has moved significantly more than 100% of its average daily range for today, you might decide (for example) to no longer open any new positions in that direction, or to close all currently open positions, for that pair, as the probability of price moving too much further is reduced. Or you might decide that price is now overbought or oversold for the day, and start to look for opportunities to trade back the other way.
If you have MT4's 'Show object description' option checked ON -- see the screenshot in post #12 below -- then a description showing the level number (50,75,100 etc) and the price will be plotted above each line. Otherwise, hover the mouse cursor over the line to see this information.
Disclaimer: Download and use at your own risk. All software is provided on an 'as is' basis.
Parameters
string UpLevels = "100";
Enter up to 10 levels, separated by commas. For example, if you want upside levels to be plotted at 50%, 75% and 100% of the ADR, enter 50,75,100
string DownLevels = "100";
Enter up to 10 levels, separated by commas. For example, if you want downside levels to be plotted at 50%, 75% and 100% of the ADR, enter 50,75,100
Or simply type a period (.), to make the DownLevels the same as the UpLevels.
int StartCandle = 0;
Enter the starting candle number where you want the leftmost point of the horizontal line to be plotted. 0 is the rightmost (currently forming) candle of the chart; 1 is the next candle to the left; and so on. You can also enter a negative number to have the line start plotting beyond the right hand edge of the chart.
If you enter 9999, the StartCandle is set to midnight (MT4 time 00:00) of the current day, and locked there until midnight of the next day.
(***new; beta***) string StartTime_hhmm = "0000";
Enter the MT4 time (hhmm) when you want each 24 hour interval ('day') to start. The open/high/low for each 24 hour interval will be calculated from this time. For example, if you enter 0330 then 03:30am MT4 time will be the open time of the 24 hour interval, and the high/low price for the day will be calculated by working forward from this time. This facility allows you to accommodate different broker timezones, or perhaps start your 'day' from the start of the London or New York session. The default value 0000 assumes that you simply want to start each new 'day' at MT4 midnight. Note that on a Monday, prior to your selected Start Time, the indicator simply uses the weekly open as its default starting point, until your Start Time is reached.
int LineLength = 5;
Enter the length of the horizontal line (number of candles to the right of the StartCandle). If you enter a negative number, the line will be extended all of the way to the right axis of the chart (a 'ray').
int ADRdays = 30;
The number of days (N) for the ADR calculation.
color UpLineColor = Gray;
color DownLineColor = Gray;
Colors for the upside and downside lines.
int LineWidth = 1;
Width of the lines (from 1 to 5).
int LineStyle = STYLE_SOLID;
Line style (0=solid, 1=dashed, 2=dotted, 3=dash-dot-dot, 4=dash-dot-dot-dot)
string Visibility = "M1,M5,M15,M30,H1,H4,D1,W1,MN";
Which timeframe charts the lines will be plotted on.
string RefreshPeriod = "M1";
How often the indicator will refresh itself, and the levels will be recalculated and replotted.
T=every tick. M1,M5 etc = the first tick on each M1, M5 etc candle.
bool FixFromOpen = false;
If false (the default value), the room to move Up/Down is calculated from today's Low/High, which changes throughout the day. This way the indicator works as described in the Overview.
If true, the room to move Up/Down is calculated from today's Open, and therefore remains fixed for the rest of the day.
string UniqueID = "0";
Creating a different UniqueID for each instance allows you to attach multiple instances of the indicator, with different settings, to the same chart.
bool UseGlobalVariables = false;
If false (the default value), no output is made to any Global Variables.
If true, the indicator maintains the values of three Global Variables:
1. RoomUpDown-[Unique ID][symbol ID]-UP = (current bid - today's low) x 100 / ADR, i.e. what percent of the ADR price is currently above today's low (thus far)
2. RoomUpDown-[Unique ID][symbol ID]-DN = (today's high - current bid) x 100 / ADR, i.e. what percent of the ADR price is currently below today's high (thus far)
3. RoomUpDown-[Unique ID][symbol ID]-OP = (current bid - today's open) x 100 / ADR, i.e. what percent of the ADR price is currently above/below (+/-) today's open
Provided that the indicator is attached to any chart, and is maintaining these values, the values can then be accessed by an EA, and used to make trading decisions. Or of course you could simply use the above calculations in your EA instead.
(***new; beta***) string PlotVerticalLine = "White,0,2";
This allows the automatic plotting of a vertical line to show where the new 'day' (the 24 hour interval defined by StartTime_hhmm) begins. To stop the line from plotting, simply leave this parameter setting blank. Otherwise there should be three entries, separated by commas: (1) the Line color (this may be any valid MT4 color token - e.g. SaddleBrown, LightGoldenrod, DodgerBlue - or RnnnGnnnBnnn, where R G B represent the red, green and blue components, and each nnn is a number between 0 and 255); (2) Line width, a value from 0 to 5; (3) Line style, 0=solid line, 1=dashed line, 2=dotted line etc, valid only if Line width<=1.
Installation
This indicator was written/compiled using MT4 build 509. If you want to modify the source (mq4), you must do this first, otherwise it will likely compile with a zillion errors. To avoid this problem, download only the ex4 file.
Or for a build 600+ version, you could try the one very generously contributed by pips4life in post #49.
Room Up/Down indicator: Terms and Conditions
All code is supplied FREE of charge. It may NOT be sold or distributed commercially. Unless otherwise shown, no source code is available.
Software is offered on an 'as is' basis. I'm not offering a programming or troubleshooting service.
There is no guarantee that the software is fit for purpose, or free of errors. Download and use the indicator(s) at your own risk; I accept no liability for computer damage or financial losses.
___________________________
Overview
This MT4 indicator operates according to a simple concept. It plots two (sets of) horizontal lines, telling you how far price must move -- up and down -- from the current price, in order for today's range to reach the same number of pips as X% of a N-day ADR. By supplying a series of values for X, you can see how far price is currently away from completing, for example, 50%, 75% or 100% of the average daily range, in both the upward and downward directions. See screenshot below for an illustrated explanation. The plotted levels move dynamically as new daily highs/lows are formed. In the screenshot you can see that, so far today, price has moved around 75% of the ADR, to the upside of the daily low.
Attached Image (click to enlarge)
In the context of a trading strategy, after price has moved significantly more than 100% of its average daily range for today, you might decide (for example) to no longer open any new positions in that direction, or to close all currently open positions, for that pair, as the probability of price moving too much further is reduced. Or you might decide that price is now overbought or oversold for the day, and start to look for opportunities to trade back the other way.
If you have MT4's 'Show object description' option checked ON -- see the screenshot in post #12 below -- then a description showing the level number (50,75,100 etc) and the price will be plotted above each line. Otherwise, hover the mouse cursor over the line to see this information.
Disclaimer: Download and use at your own risk. All software is provided on an 'as is' basis.
Parameters
string UpLevels = "100";
Enter up to 10 levels, separated by commas. For example, if you want upside levels to be plotted at 50%, 75% and 100% of the ADR, enter 50,75,100
string DownLevels = "100";
Enter up to 10 levels, separated by commas. For example, if you want downside levels to be plotted at 50%, 75% and 100% of the ADR, enter 50,75,100
Or simply type a period (.), to make the DownLevels the same as the UpLevels.
int StartCandle = 0;
Enter the starting candle number where you want the leftmost point of the horizontal line to be plotted. 0 is the rightmost (currently forming) candle of the chart; 1 is the next candle to the left; and so on. You can also enter a negative number to have the line start plotting beyond the right hand edge of the chart.
If you enter 9999, the StartCandle is set to midnight (MT4 time 00:00) of the current day, and locked there until midnight of the next day.
(***new; beta***) string StartTime_hhmm = "0000";
Enter the MT4 time (hhmm) when you want each 24 hour interval ('day') to start. The open/high/low for each 24 hour interval will be calculated from this time. For example, if you enter 0330 then 03:30am MT4 time will be the open time of the 24 hour interval, and the high/low price for the day will be calculated by working forward from this time. This facility allows you to accommodate different broker timezones, or perhaps start your 'day' from the start of the London or New York session. The default value 0000 assumes that you simply want to start each new 'day' at MT4 midnight. Note that on a Monday, prior to your selected Start Time, the indicator simply uses the weekly open as its default starting point, until your Start Time is reached.
int LineLength = 5;
Enter the length of the horizontal line (number of candles to the right of the StartCandle). If you enter a negative number, the line will be extended all of the way to the right axis of the chart (a 'ray').
int ADRdays = 30;
The number of days (N) for the ADR calculation.
color UpLineColor = Gray;
color DownLineColor = Gray;
Colors for the upside and downside lines.
int LineWidth = 1;
Width of the lines (from 1 to 5).
int LineStyle = STYLE_SOLID;
Line style (0=solid, 1=dashed, 2=dotted, 3=dash-dot-dot, 4=dash-dot-dot-dot)
string Visibility = "M1,M5,M15,M30,H1,H4,D1,W1,MN";
Which timeframe charts the lines will be plotted on.
string RefreshPeriod = "M1";
How often the indicator will refresh itself, and the levels will be recalculated and replotted.
T=every tick. M1,M5 etc = the first tick on each M1, M5 etc candle.
bool FixFromOpen = false;
If false (the default value), the room to move Up/Down is calculated from today's Low/High, which changes throughout the day. This way the indicator works as described in the Overview.
If true, the room to move Up/Down is calculated from today's Open, and therefore remains fixed for the rest of the day.
string UniqueID = "0";
Creating a different UniqueID for each instance allows you to attach multiple instances of the indicator, with different settings, to the same chart.
bool UseGlobalVariables = false;
If false (the default value), no output is made to any Global Variables.
If true, the indicator maintains the values of three Global Variables:
1. RoomUpDown-[Unique ID][symbol ID]-UP = (current bid - today's low) x 100 / ADR, i.e. what percent of the ADR price is currently above today's low (thus far)
2. RoomUpDown-[Unique ID][symbol ID]-DN = (today's high - current bid) x 100 / ADR, i.e. what percent of the ADR price is currently below today's high (thus far)
3. RoomUpDown-[Unique ID][symbol ID]-OP = (current bid - today's open) x 100 / ADR, i.e. what percent of the ADR price is currently above/below (+/-) today's open
Provided that the indicator is attached to any chart, and is maintaining these values, the values can then be accessed by an EA, and used to make trading decisions. Or of course you could simply use the above calculations in your EA instead.
(***new; beta***) string PlotVerticalLine = "White,0,2";
This allows the automatic plotting of a vertical line to show where the new 'day' (the 24 hour interval defined by StartTime_hhmm) begins. To stop the line from plotting, simply leave this parameter setting blank. Otherwise there should be three entries, separated by commas: (1) the Line color (this may be any valid MT4 color token - e.g. SaddleBrown, LightGoldenrod, DodgerBlue - or RnnnGnnnBnnn, where R G B represent the red, green and blue components, and each nnn is a number between 0 and 255); (2) Line width, a value from 0 to 5; (3) Line style, 0=solid line, 1=dashed line, 2=dotted line etc, valid only if Line width<=1.
Installation
This indicator was written/compiled using MT4 build 509. If you want to modify the source (mq4), you must do this first, otherwise it will likely compile with a zillion errors. To avoid this problem, download only the ex4 file.
Or for a build 600+ version, you could try the one very generously contributed by pips4life in post #49.
Attached File(s)