thank you jam for your help. It works now but how do I make it look like a histogram with colors
Ignored
Yes, its supposed to be period like in the picturebook. You can change the way your indicator looks by selecting chart type as histogram. Looks like its working tho!
What a day yesterday! The system really showed us what its made of!
I posted on this thread in the beginning using a variation of this system (the acutal 12 b.bands around the price) along with Dollie's system. I am posting 2 trades I got today (I'm a scalper).
Are we any closer to getting at MT4 Squeeze indicator or is it a lost cause. I would love to add that to my arsenal.
GCT - if not, does your platform allow for free demos so I can access the charts?
Ignored
Any places that offers IT Finance charts will only give you two weeks trial.
Try CMCMARKETS....
Any places that offers IT Finance charts will only give you two weeks trial.
Try CMCMARKETS....
Ignored
Correct, the charting package I use comes with IGMarkets but they get them from prorealtime. This charting package from them is more comprehensive with sms alerts, mobile trading and years and years of data. But you do have to pay for that. The trial goes only for a week, but would give you a feel for it.
Otherwise there are two brokers that use them, cmc and IGMarkets. I personally use IGMarkets and have had no problems.
Bband Squeeze v3 Indicator with Bband and MACD Alert!
EA in progress..
Thanks GCTrader1 for great system!!!
Ignored
I love it alexish haha, appreciated for sharing.
One note going back to the .0056 value, wondering if you would consider changing it to a variable based on the low of last 132 as we discussed earlier since you will get substantially different entries, sometimes a difference of 1-3 bars and sometimes even false entries that you should not have been done.
Give it some thought, but I love the progress so far and of course thanks for sharing this with everyone, will use this myself to live backtest more data...much easier with alerts :-) thanks!
I'm using the IGMarkets' IT Finance charts. Maybe you can tell me where I've gone wrong - I create a new indicator, paste the new trigger code post #283). Then when I validate it tells me I've got a syntax error, needing to define variables : period, A & C. I think its the variables I need help with- the 'Type', 'Restriction' and 'Default value" bit.
Should I be just editing the old/first squeeze indicator? Or am I right to create a new indicator.
I know zip about programming so please excuse my un-tech savvyness.
Guess121 - I saw an earlier post of yours where you said you had a problem with the new coding. Looks like you've managed to sort it out, any advise?
Thanks, and apologies for bothering you guys with the little nitty gritty bits. Ur time is much appreciated!
jonaslt you are the man... this is the thing i was looking for!!!
Thanks.
Alexish, if you could add this, it be the final part I think... what do you think guys?
Ignored
Going on what I have seen now with my auto updating trigger, it is a necessity! Your a champion alexish, thanks for putting in the time. Im sure every one is depositing donations into your account as we speak!
I have been successful 8 of 11 tries using the pivot point squeeze. Takes discipline to not be too greedy with your limits, but, if you can achieve this discipline then this is a great system where you can be fairly tight with your stops!
I think the thing with tight stops is a problem, besides the fake breakouts that retrace back to the range...often there's the 1,2,3 pattern with the breakout so if you have a tight stop even if you are up it often retraces to the higher/lower limit of the consolidation range and would close you out if you have a tight stop.
I was just thinking of this today but on say 1HR frames if you only took entries after it bounces off the pivot the second time and starts shooting off your chances of winning increase. This is just my thought process from what I've learned from PA, for example my trade yesterday was a perfect example since I entered on the first bounce off the pivot, it retraced close to a couple pips to the pivot and bounced off again, I was lucky in this case since it didn't break the pivot and go the other way.
Just some ideas to wonder about, I'm not sure how true this is and if this makes sense to anyone else but the longer I look at the charts the more I see heh,
post if you have any ideas we can all improve on.
But as for stops, the way I'm looking at it now is if I see any patterns then try to place the SL 10 pips away from it or so on the other side, still have to play around with the figures more just using what GCT suggested he uses so will try it for now.
GCT just wondering, how much PA analysis do you use for predicting the trend on your tf before you enter a trade aside from pivots, because you don't always enter solely based on macd I believe, let me know if I'm wrong.
Bband Squeeze v3 Indicator with Bband and MACD Alert!
EA in progress..
Thanks GCTrader1 for great system!!!
Ignored
Alexish,
Thanks a lot for your hard work. I just try it and have couple of questions for you and as well as others.
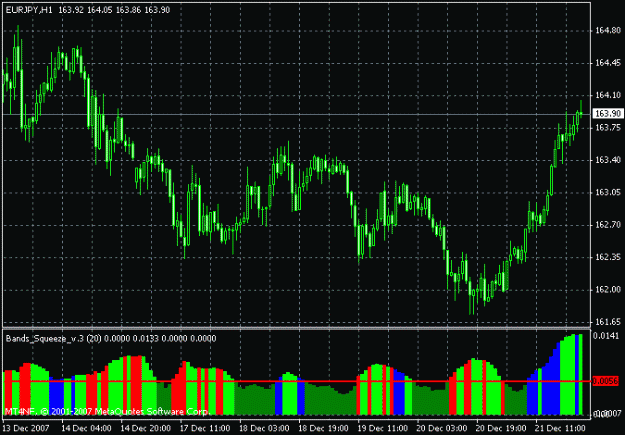
First of all look at my chart, and I was wondering if it is supposed too be. I cannot see MACD even though it is in the input section. Then my other question is how to interprent this chart. What do all colors mean? I guess I got confused.
Alexish,
Thanks a lot for your hard work. I just try it and have couple of questions for you and as well as others.
First of all look at my chart, and I was wondering if it is supposed too be. I cannot see MACD even though it is in the input section. Then my other question is how to interprent this chart. What do all colors mean? I guess I got confused.
Ignored
I'm not sure but you're not supposed to see macd, this graph tells you where it's going...
dark green bars under the "magical number"
red, over the number, macd is - and decreasing
blue, over the number, macd is + and increasing
light green, over the number, but macd in opposite direction of macd trend or stalled
let me know alexish if I'm wrong :-)
Ignored
Jonaslt,
Thanks for explanation. I think It would be nice to be able to see MACD and bollinger bands/bandwidth. I think it gives more visibility. So if those are the cases like you explained, are we using entry and exit strategies as GCTrader expalined in his word document as follow?
Entering a trade
The first thing to look for is the narrowing of the Bollinger bands. When the Bollinger bandwidth crosses under the trigger line, you want to keep an eye out for a low on the histogram followed by an increase in bandwidth. This is a signal that it maybe breaking out and that is the entry point. Enter the market long if the MACD is trending up or short if it is trending down. Put more simply, trade in the way that the market is breaking away.
When I enter a position, I enter a wide stop loss as the EUR/JPY can be volatile and go in the other direction before it trends in the predicted direction.
Exiting a trade
When the MACD histogram is starting to turn in the opposite direction of the trade with a certain threshold of this turn, it can signify an end to the rally. The threshold must be set at a level which is not too sensitive as to make you exit a longer profitable trade but not too lenient as to give much of your profits back. Experimenting with this level is the only way to know which is best for different pairs.
Another way to plan your exits is to stage out at differing pivot levels. Say you enter a trade when it breaks down from the Pivot point. You would exit say half your lots at the 1st support line and then move your stop loss up to entry. Then your remaining lots at the 2nd support.
I'm not sure but you're not supposed to see macd, this graph tells you where it's going...
dark green bars under the "magical number"
red, over the number, macd is - and decreasing
blue, over the number, macd is + and increasing
light green, over the number, but macd in opposite direction of macd trend or stalled
let me know alexish if I'm wrong :-)
Ignored
Absolutely correct! Thanks jonaslt!
Use only one choice:
The signal when the price hit up or down line of Bbands :
BbandAlert = true;
MACDAlert = false;
The signal like said jonaslt (from MACD) :
BbandAlert = false;
MACDAlert = true;
Tregger line is variable.. You can set other values if you whant...(optimize for other pairs)
The signal when the price hit up or down line of Bbands :
BbandAlert = true;
MACDAlert = false;
The signal like said jonaslt (from MACD) :
BbandAlert = false;
MACDAlert = true;
Tregger line is variable.. You can set other values if you whant...(optimize for other pairs)
Ignored
Good to know I had it right hehe, thanks again for all the coding.
"Tregger line is variable", I know I can set them, but what I meant is according to Bollinger as GCT discussed earlier with bibls I believe (sry if I chopped your name up), the trigger line is based on the low of the last 132 bars, I wondered if it wouldn't be too hard to code that so it would change auto if you were up to it because then you could use this indicator on any pair and tf without changing the trigger line since it always changes according to the low.
This would eliminate the need to always change the trigger on the same pair as well if it was passed under during the last 132 bars.
I think I wrote it wrong the first time, what I meant by variable is changing by itself not a set variable thats modifiable.
Jonaslt,
Thanks for explanation. I think It would be nice to be able to see MACD and bollinger bands/bandwidth. I think it gives more visibility. So if those are the cases like you explained, are we using entry and exit strategies as GCTrader expalined in his word document as follow?
Ignored
Yes, what Alexish coded is exactly what GCT uses for entry at least, once the bandwidth increases from the minimum after a squeeze thats when we supposedly enter.
One problem with the current Alexish's setup is that the level is a constant variable and does not set itself to the minimum it is supposed to be, so you have to set it manually to the lowest value of the last 132 bars (5.5 days if you're using H1)
I brought this up earlier but there was some confusion with the wording :-)