Hello again! Here's a summary of what happened last week:
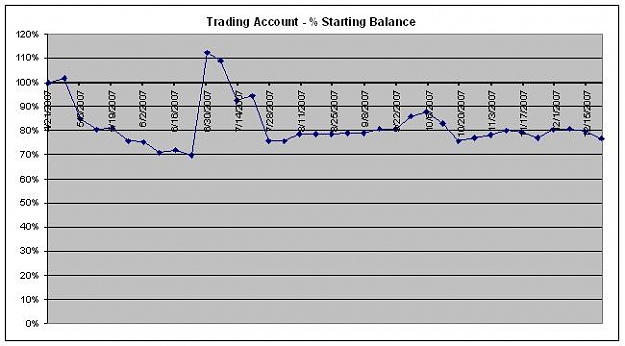
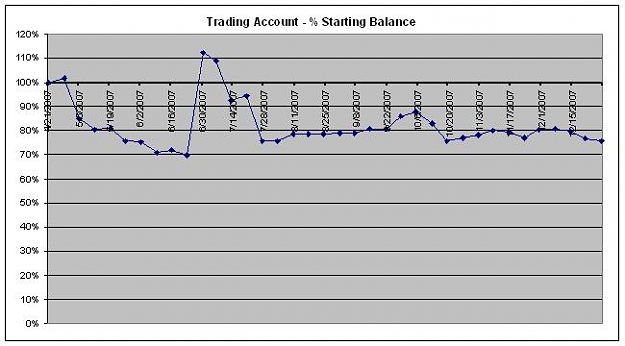
1. I broke even
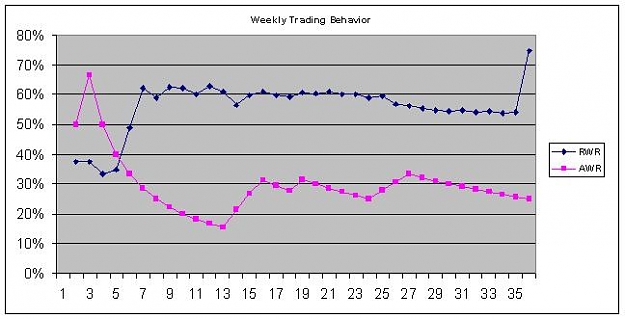
2. My scalping needs a LOT of work
3. I had my first ever trading dream/vision
1. Longer term trades
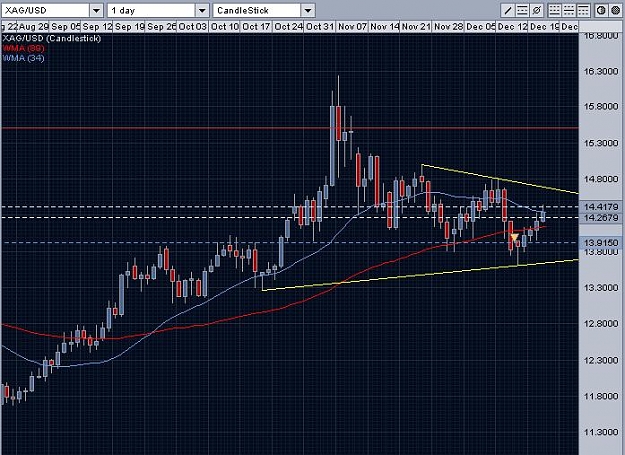
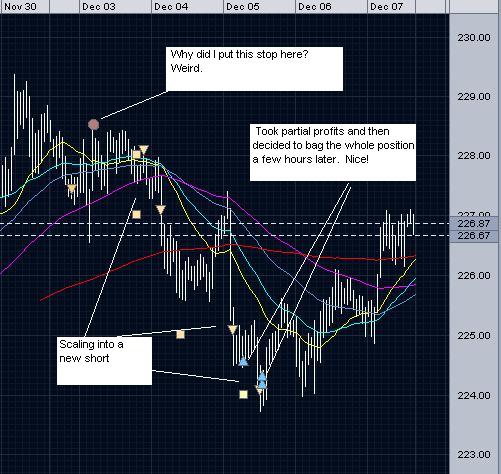
As I mentioned in one of the previous posts, I started the week with a big negative opinion on the USD and GBP/JPY. Opened a short on GBP/JPY with too tight a stop on Monday's London session and lost a little there. Then I started building another short by scaling in and made the money back on that before I noticed around mid-week that the downward momentum seemed to be gone, so I closed that out too. Just in the nick of time, which is pretty unusual for me. Here are those trades:
I also had a short on the USD/CHF, but when all the good US news started coming out, I closed that too pretty close to B/E. I also had a long EUR/AUD position that I closed at about B/E. So with all my longer term positions closed out, I spent the rest of the week concentrating on my scalping skills with EUR/JPY.
2. Scalping
I am only using very tiny units, so I don't really make or lose any significant portion of my account on these. I might lose 10 trades in a row and not worry too much about it. This is the steep part of the learning curve and there's no reason to increase my trade size until I can consistently make a profit.
Anyway, it takes some genius to be able to go long 5 times in an uptrend and lose every time, but that's what I did on NFP Friday. I've been testing different sets of entry rules by writing them down and then trading them over and over again in a single session regardless of whether they're working or not. The idea is to build the discipline to follow the rules, and also to spot repeated price behavior that either helps or defeats the strategy.
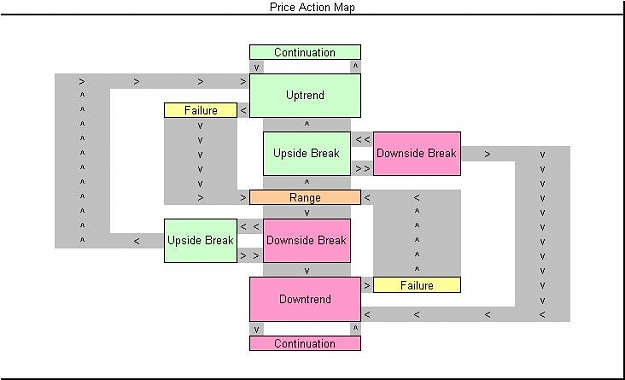
One thing that I've been learning is that if I'm following a trend in one TF, I should not be looking for momentum in the trend direction in the LOWER TF. When one TF is trending, the lower one is oscillating around that directional bias. Say the main trend is up. If the price starts to go up in the lower TF, then what you have is WAY too much momentum at the moment. The reason is that in order to go from the bottom of an upwardly sloping channel to the top, the price slope has to be really high and unsustainable. On the other hand, it's easy to go from the top of an upward channel to the bottom; all you have to do is move sideways or slightly down.
FIRST ORDER APPROXIMATION: : When following a trend in one TF, look for tops and bottoms in the lower TFs.
3. Trading Dream
Ok, now I'm a math/science guy, not superstitious and very skeptical about any kind of paranormal stuff so I don't want to give the impression that I'm going down THAT road with this next part. There are perfectly logical explanations for why things "come to us" in dreams; subconscious mind turning the problem over, etc. But it was kind of freaky anyway!
Jack Schwager talked about this kind of thing in Market Wizards. He had a dream where Ed Seykoyta made some comment about Jack's trade and Jack closed the thing the next day I think.
Anyway, so Saturday morning I was still in bed around 9:30 or so and I was having a series of those little short dreams you have right around the time you're coming awake. A bunch of people from where I used to work were watching the Super Bowl next door, then I was explaining to someone in my kitchen that I had left that job a few months ago... and then the third dream.
The third dream didn't have any action. It was just a price chart. I could see it clearly, and there were groups of consecutive price bars color coded either green, yellow or red. On the left of the chart was a group colored green, and each of those bars had a lower low than the prior bar. On the right there was a sort of hazy group of yellow and then red bars, all of which were moving up. Right in the middle of the green group of bars was a notation that said, "This is a signal." That's when I woke up.
My first thought on waking up was "I know who killed Laura Palmer!!!" Oops, Twin Peaks flasback there... sorry.
No, actually my first thought on waking up was, "Yeah no kidding it's a signal. I mean how many lower lows can you have in an uptrend before the thing shoots up right??" My second thought was, "Wait, what? Did I just have a DREAM about a price chart??" :surprised Weird. Weird.
In my next post I'll put up my market radar and plans for the coming week.
1. I broke even
2. My scalping needs a LOT of work
3. I had my first ever trading dream/vision
1. Longer term trades
As I mentioned in one of the previous posts, I started the week with a big negative opinion on the USD and GBP/JPY. Opened a short on GBP/JPY with too tight a stop on Monday's London session and lost a little there. Then I started building another short by scaling in and made the money back on that before I noticed around mid-week that the downward momentum seemed to be gone, so I closed that out too. Just in the nick of time, which is pretty unusual for me. Here are those trades:
Attached Image
I also had a short on the USD/CHF, but when all the good US news started coming out, I closed that too pretty close to B/E. I also had a long EUR/AUD position that I closed at about B/E. So with all my longer term positions closed out, I spent the rest of the week concentrating on my scalping skills with EUR/JPY.
2. Scalping
I am only using very tiny units, so I don't really make or lose any significant portion of my account on these. I might lose 10 trades in a row and not worry too much about it. This is the steep part of the learning curve and there's no reason to increase my trade size until I can consistently make a profit.
Anyway, it takes some genius to be able to go long 5 times in an uptrend and lose every time, but that's what I did on NFP Friday. I've been testing different sets of entry rules by writing them down and then trading them over and over again in a single session regardless of whether they're working or not. The idea is to build the discipline to follow the rules, and also to spot repeated price behavior that either helps or defeats the strategy.
One thing that I've been learning is that if I'm following a trend in one TF, I should not be looking for momentum in the trend direction in the LOWER TF. When one TF is trending, the lower one is oscillating around that directional bias. Say the main trend is up. If the price starts to go up in the lower TF, then what you have is WAY too much momentum at the moment. The reason is that in order to go from the bottom of an upwardly sloping channel to the top, the price slope has to be really high and unsustainable. On the other hand, it's easy to go from the top of an upward channel to the bottom; all you have to do is move sideways or slightly down.
FIRST ORDER APPROXIMATION:
3. Trading Dream
Ok, now I'm a math/science guy, not superstitious and very skeptical about any kind of paranormal stuff so I don't want to give the impression that I'm going down THAT road with this next part.
Jack Schwager talked about this kind of thing in Market Wizards. He had a dream where Ed Seykoyta made some comment about Jack's trade and Jack closed the thing the next day I think.
Anyway, so Saturday morning I was still in bed around 9:30 or so and I was having a series of those little short dreams you have right around the time you're coming awake. A bunch of people from where I used to work were watching the Super Bowl next door, then I was explaining to someone in my kitchen that I had left that job a few months ago... and then the third dream.
The third dream didn't have any action. It was just a price chart. I could see it clearly, and there were groups of consecutive price bars color coded either green, yellow or red. On the left of the chart was a group colored green, and each of those bars had a lower low than the prior bar. On the right there was a sort of hazy group of yellow and then red bars, all of which were moving up. Right in the middle of the green group of bars was a notation that said, "This is a signal." That's when I woke up.
My first thought on waking up was "I know who killed Laura Palmer!!!" Oops, Twin Peaks flasback there... sorry.
No, actually my first thought on waking up was, "Yeah no kidding it's a signal. I mean how many lower lows can you have in an uptrend before the thing shoots up right??" My second thought was, "Wait, what? Did I just have a DREAM about a price chart??" :surprised Weird. Weird.
In my next post I'll put up my market radar and plans for the coming week.