Thanks Aus, i will also check tomorrow's daily setup. This morning you were a little bit late in posting your analysis, i waited for your analysis. I went on to place my trade cos it's a demo account.
I have placed my long trade before the retracement with 100 pip stop loss.
I noticed this, the retracement ended when 1hr QQe crossed to bullish but not 50 line and also above Gann HiLo, and at the same time 15min QQe 5 crossed 50 line and above Gann HiLo.
Can this be a godd entry for long after a bear retracement in a bullish trend? cos for today, i placed my long at 224.91 at around 00.50GMT. 15min and 1hr long signal as i explained earlier, occured at 3.35GMT and 3.00GMT at 224.68 after the retracement. Is this 15min and 1hr occurence good to follow?
MASTER AUSLANCO
It sounds like you getting a cheap thrill when the trades hits my stop loss no .. I'm out with the GU.
Ignored
and its not the first time aus. people expect you to be 100% right all the time and when the overrleverage there accts. based on your analysis they get mad. lol
I'm looking forward to more predictions on swing positions (even if you don't trade live).. like the weekly G/J chart that you posted earlier.
And, have you been looking at these momentum charts for other pairs as well? if you are, please keep us posted. it will be a great benefit if this at least sort of gives a vague idea of how things 'may' turn out.. then fine-tuning can be done for each particular pair.
Thanks. So in that case, the 1C is basically comparing the close price of the previous bar against the opening price of the new one, if it's checked immediately after the new one has formed. Hmm . . .
Ignored
With all due respect to Aus Master, now you also see the problem of mtm 1c.
let's assume you watch mtm 1c for daily chart in such a scenario:
Yesterday, GJ closed 224.98. in the 1st minute of today, if u check the mtm 1c, how much price moved in this 1 minute? usually, not too much. OK, suppose price moves 0 (very realistic), so current price basically = the close price of yesterday (224.98). then mtm 1c = current price - closeprice of yesterday = 224.98 -224.98 = 0. Now, if mtm 1c of yesterday is a negative value. say, -2.59. From -2.59 of yesterday to 0 of today, mtm 1c will draw a "sharp up bend" on the chart.
that's how u get it. Now is it indicating a reversal or retrace? I don't believe it. mtm 1c in any TF at the very beginning of (such as the first 10 seconds) a new bar will 90% point to 0. It is simply because the current price is approximately the close price of last bar.
I do think mtm 10, mtm 14, are good to support analysis. I use mtm 4 in place of mtm 1. Just my 2 cheap cents.
Many sincere thanks to Aus Master for his constant analysis here.
Ignored
Hi charvo.. I must say you are only partly right. 1C keeps pointing down to the Zero level untll the price hits the true market price (5sma Close). once the price hits 5sma it gives us the correct direction to take the trade.. I will discuss this in detail next week. I'm down with a severe flu..
study daily price movement based on momentum indicator took us 24 hrs... For us to study , why dont we look at shorter tf, such as 5 min, What happen to the price at the end of the tf if 1C pointing down, 10 and 14 pointing up, or what ever condition. i think it may help us to understand momentum better..
Hi charvo.. I must say you are only partly right. 1C keeps pointing down to the Zero level untll the price hits the true market price (5sma Close). once the price hits 5sma it gives us the correct direction to take the trade.. I will discuss this in detail next week. I'm down with a severe flu..
Ignored
Take care, dear master, health is always NO 1. posting here is not. you need sleep. Hope to see your analysis soon, which means u'll recover well then.
study daily price movement based on momentum indicator took us 24 hrs... For us to study , why dont we look at shorter tf, such as 5 min, What happen to the price at the end of the tf if 1C pointing down, 10 and 14 pointing up, or what ever condition. i think it may help us to understand momentum better..
Ignored
it may not, i guess. under 15 min (actually 1h, imho), too much noise for newbies. I know some masters do 5 min trading. but for newbies, look 1h/4h beyond is better.
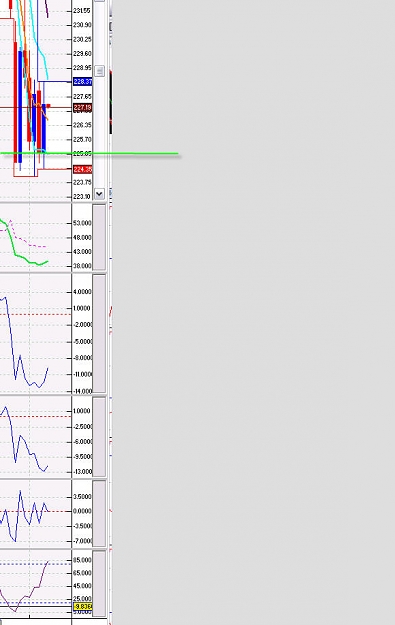
Hello guys, just got an update on my VT and MT4 platform for the GJ, the new daily set-up. 1c pointing down, 10c and 14c pointing up, stoch RSI pointing up.
4hr 14c pointing down while 1c and 10c up, stochRSi flat.
1hr 1c pointing down 14c and 10c up, price below Gann.
I am looking at a bearish reversal on daily to 5sma close before bullish trend.
Please can anyone also share his/her analysis to be sure of today's bias if bullish.
Hi bruce,
What do you see about the daily setup? can i share out of what you analysed?
I think Aus should be treating himself by now, i pray for an early recorvery for him.
227.70 is my Long target for today. This may go higher than that.. but I'm out for the day.. It's intresting to see where the candle would end today.. I'm expecting a large fall next week beyond 218.
Ignored
I was expecting the GU to ride up a little more here giving the GJ a lift to the levels of 229.50 to 232.00, I also have shorts waiting all the way up to 234.
I am expecting the overall move to finally go down and test then break 219 on it's way down to 215/216.
Let's be cautious and prepared on this retracement to the 61.8 and upper trend line test, from there, as you say FREE FALL.
Note: I am taking the 61.8% from the Weekly chart, which is 234.70, the 5SMA on the weekly stands at a double top area of 232.00/50 area.
My overall thoughts are 232 area on this final push up before the MELTDOWN.
Ken
Ignored
Hi bro.
Yesterday I thought the 232 level could be achievable within this week.. but yesterdays daily bar failed to touch the 5sma (high) indicating bulls are very weak..The price is not ready to move up beyond the current range..As we are getting closer to end of the month(with a very bearish momentum) price may not go too high. 219 before end of the month is my prediction.