This is a simple trading guideline method, oriented to be a tool in identifing the current momentum wave direction. The system may be used on all TFs (and cross pairs), cause momentum waves act in every TF. Lets do not forget that price movements are technically GENERATED from price-wave momentums!  So that’s the point!
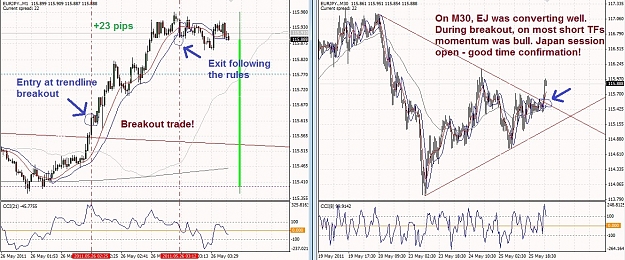
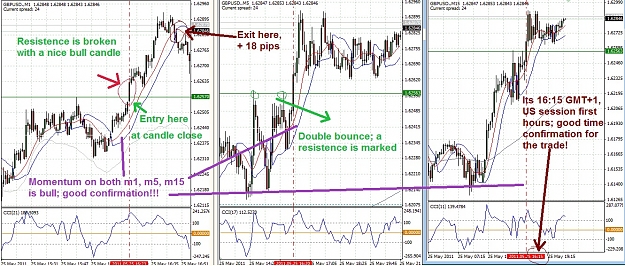
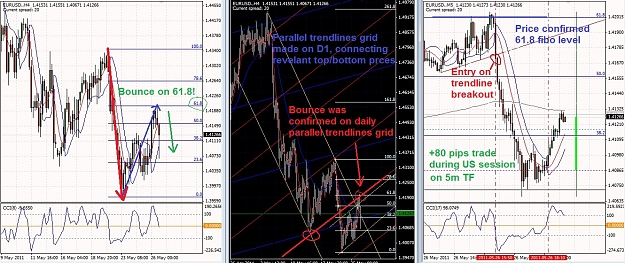
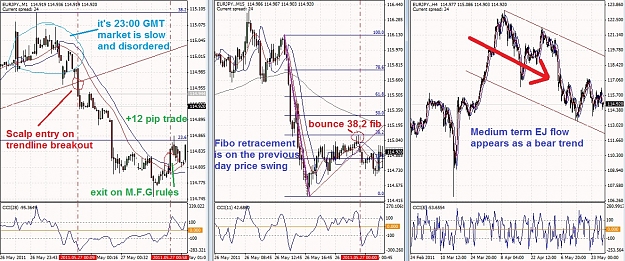
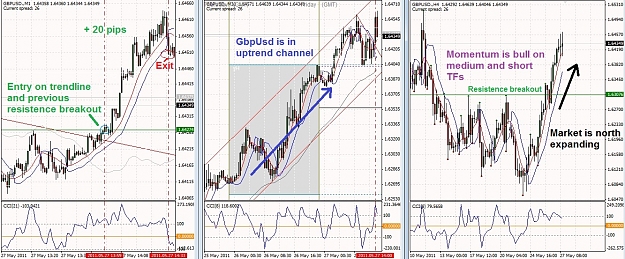
The idea is to jump into the price wave as early as possible and stay in, until momentum’s energy is acting. A good entry confirmation may be done from the momentum’s direction on higher TFs + some general market conditions, like good volatility and price efficiency.
I RECOMMEND TO USE THIS SYSTEM FOR INTRADAY TRADING. Anyway, rules may be applied also for H1, H4, D1 and W1 time frames.
System signals has not to be taken blindly in series, as they come. M.F.G System acts as a GUIDELINE source only. Its template may be switched from one minute to one month (parameters will change). Here is how system signals work:
BULL MOMENTUM SET (evaluate for Long Trade):
- price above red MA (T3)
- red MA (T3) above blue MA (Gann HLA)
- cci cross above zero level (confirmation signal)
BEAR MOMENTUM SET (evaluate for Short Trade):
- price below red MA (T3)
- red MA (T3) below blue MA (Gann HLA)
- cci cross below zero level (confirmation signal)
EXIT SIGNALS (evaluate for Trade Exit):
1st condition (light signal): price closes below red MA (for long trade); above red MA (for short trade)
2nd condition (relevant signal): 1st condition + cci below zero level (for long trade) or cci above zero level (for short trade)
3rd condition (strong signal): 1st & 2nd conditions + red & blue MA crosses again
General exit condition: price touches S/R level, trendline, pivot, fibo, on divergence, if price is considered OB/OS or others generic rules.
SL & MM RULES (plan your Trading Efficiency):
It is recommended always to place a SL while trading! Stop Loss orders may be placed a little outside the blue MA, this is a general rule. SL may be placed also closer. It is intelligent to protect your profits moving the SL and risk less than 3% of your account in every trade. Look for good risk-reward set ups.
TECHNICAL TREND CALCULATION:
(trading a just borned trend formation is more profit-favorable )
)
- Use M.F.G. System to determinate what is the actual Wave Momentum on 2-3 higher TFs than the one you trade.
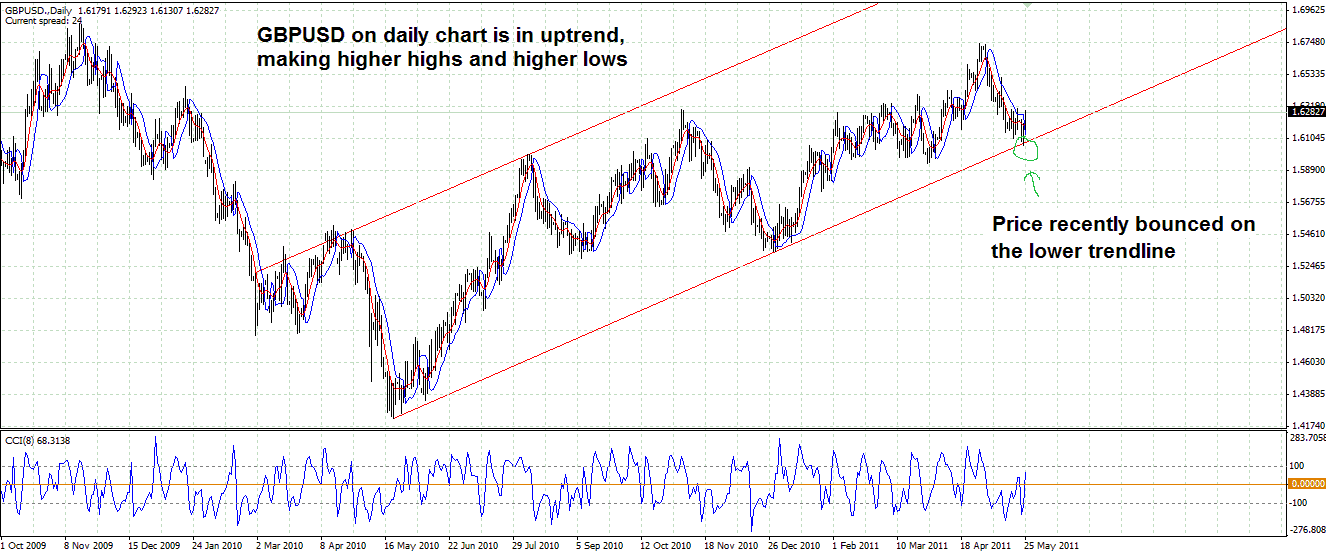
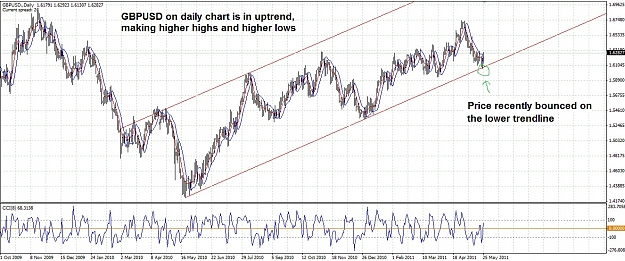
- Observe how are positioned the last HIGHs and LOWs on the upper TFs.
- Observe if higher TFs are EXPANDING through a fractal breakout, or they stay between an upper and a lower fractal.
- Observe the average inclination of the tendency price flow, on higher TFs.
- Observe recent price waves swings on higher TFs and in which direction the move is bigger.
NOTE: exceptional market conditions, a drop of volatility or price efficiency may compromise classical rules for trend calculation!!!
I HIGHLY RECOMMEND this guideline system to beginner traders, cause its simplicity and because it permits to observe how price action works. This experience may be very important for their future trading carrer. Thousands of indicators, or thousands of entry/exit rules may mostly confuse and blind every aspiring trader.
Template is in its basic form, and one may add whatever he likes. It is calibrated for USD cross pairs. I made a second one for YEN pairs, where m1 and m5 got different parameters. (On both templates, from m1 to m30 is plotted the projection of a 24h EMA as a short term reference MA.)
The idea is to jump into the price wave as early as possible and stay in, until momentum’s energy is acting. A good entry confirmation may be done from the momentum’s direction on higher TFs + some general market conditions, like good volatility and price efficiency.
!!!![]() M.F.G. System REQUIRES good Price Action analysis skills
M.F.G. System REQUIRES good Price Action analysis skills ![]() !!!
!!!
I RECOMMEND TO USE THIS SYSTEM FOR INTRADAY TRADING. Anyway, rules may be applied also for H1, H4, D1 and W1 time frames.
System signals has not to be taken blindly in series, as they come. M.F.G System acts as a GUIDELINE source only. Its template may be switched from one minute to one month (parameters will change). Here is how system signals work:
BULL MOMENTUM SET (evaluate for Long Trade):
- price above red MA (T3)
- red MA (T3) above blue MA (Gann HLA)
- cci cross above zero level (confirmation signal)
BEAR MOMENTUM SET (evaluate for Short Trade):
- price below red MA (T3)
- red MA (T3) below blue MA (Gann HLA)
- cci cross below zero level (confirmation signal)
EXIT SIGNALS (evaluate for Trade Exit):
1st condition (light signal): price closes below red MA (for long trade); above red MA (for short trade)
2nd condition (relevant signal): 1st condition + cci below zero level (for long trade) or cci above zero level (for short trade)
3rd condition (strong signal): 1st & 2nd conditions + red & blue MA crosses again
General exit condition: price touches S/R level, trendline, pivot, fibo, on divergence, if price is considered OB/OS or others generic rules.
SL & MM RULES (plan your Trading Efficiency):
It is recommended always to place a SL while trading! Stop Loss orders may be placed a little outside the blue MA, this is a general rule. SL may be placed also closer. It is intelligent to protect your profits moving the SL and risk less than 3% of your account in every trade. Look for good risk-reward set ups.
TECHNICAL TREND CALCULATION:
(trading a just borned trend formation is more profit-favorable
- Use M.F.G. System to determinate what is the actual Wave Momentum on 2-3 higher TFs than the one you trade.
- Observe how are positioned the last HIGHs and LOWs on the upper TFs.
- Observe if higher TFs are EXPANDING through a fractal breakout, or they stay between an upper and a lower fractal.
- Observe the average inclination of the tendency price flow, on higher TFs.
- Observe recent price waves swings on higher TFs and in which direction the move is bigger.
NOTE: exceptional market conditions, a drop of volatility or price efficiency may compromise classical rules for trend calculation!!!
!!! Use M.F.G. System as a guideline for your Price Action projections !!!
I HIGHLY RECOMMEND this guideline system to beginner traders, cause its simplicity and because it permits to observe how price action works. This experience may be very important for their future trading carrer. Thousands of indicators, or thousands of entry/exit rules may mostly confuse and blind every aspiring trader.
Template is in its basic form, and one may add whatever he likes. It is calibrated for USD cross pairs. I made a second one for YEN pairs, where m1 and m5 got different parameters. (On both templates, from m1 to m30 is plotted the projection of a 24h EMA as a short term reference MA.)
Attached Image(s) (click to enlarge)

Attached File(s)