that is actually nothing new, i know people here in this forum who trades like that
- Post #2,341
- Quote
- Jul 17, 2021 8:01am Jul 17, 2021 8:01am
- Joined Feb 2009 | Status: Member | 2,293 Posts
- Post #2,342
- Quote
- Jul 17, 2021 8:22am Jul 17, 2021 8:22am
- Joined Feb 2009 | Status: Member | 2,293 Posts
- Post #2,344
- Quote
- Jul 17, 2021 9:19am Jul 17, 2021 9:19am
- Joined Feb 2009 | Status: Member | 2,293 Posts
- Post #2,346
- Quote
- Jul 20, 2021 2:49am Jul 20, 2021 2:49am
- Joined Feb 2009 | Status: Member | 2,293 Posts
- Post #2,348
- Quote
- Sep 15, 2022 4:16am Sep 15, 2022 4:16am
- Joined Jan 2020 | Status: Member | 2,283 Posts
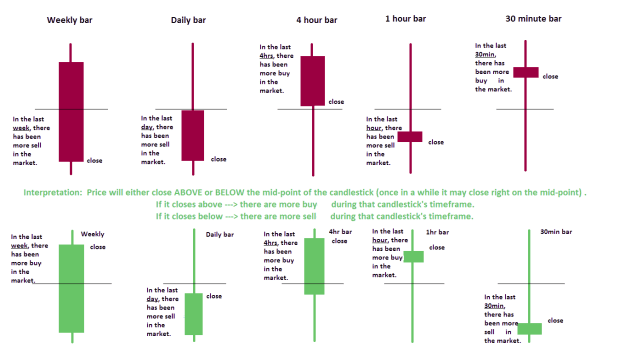
Trade the value
- Post #2,356
- Quote
- Mar 24, 2023 9:20am Mar 24, 2023 9:20am
- Joined Feb 2006 | Status: Member | 2,043 Posts

- Post #2,359
- Quote
- Apr 2, 2023 4:04pm Apr 2, 2023 4:04pm
- Joined Feb 2006 | Status: Member | 2,043 Posts