{quote} Not difference. If you see panel, Numbers are black and background dont have color showing if strong or weak. All black {image} Very werid. I open other chart and was showed fine.
Ignored
Try setting of the draggable indictors option to off in the settings.
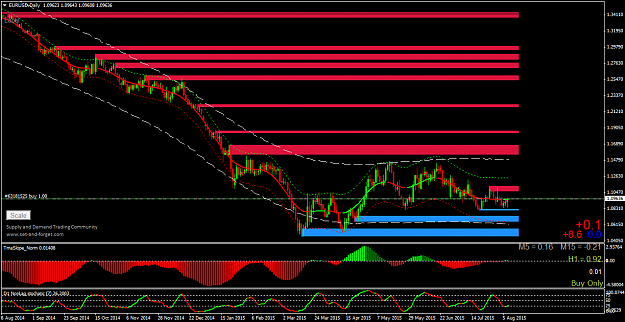
im hoping you maybe able to help me complete this system i been working on
basically its hurst cycles using indicator FastTMALine
the rules are inner band has to be close to outer band
price willbe to the edge if not thre the bands to extreme
price into supply demand zone
centreline colour in direction of trade
tmaslope above or below 0 line (bullish or bearish)
stochastics overbought/oversold
alerts are on price entering supply demand zone and fasttmaline centreline change
ideally guys would be nice if all 28 pairs could be monitored on all timeframes with out the charts being open.
a dashboard with all 28 pairs listed and the timeframes show,,,,with direction of trade represented by arrows up or down
so,,,how do we know which way the 2 channels are going?by both bands centreline being the same
so example if looking on a 1hr chart,,inner band would be 1hr and when outerband 4hr,,,so when both are showing same direction via the fasttmaline centreline we get alert on dashboard
the extra confirmation is price in supply demand zone and tmaslope crossing 0 along with stochastics agreeing
i know there are more experienced coders and traders then me here,,,,so i would take recommended advice in out to have a dashboard setup
its a long job to check the charts a dashboard could do most the work for you.
guys i really appreciate any help you can do and many thanks in advance
Hi Guys, im hoping you maybe able to help me complete this system i been working on basically its hurst cycles using indicator FastTMALine
Ignored
Hi Devon
Thank you for sharing your Supply/Demand system with everyone
Short of creating an EA or a 'new' dashboard (it DOES look interesting)
I recommend you install your system, indys and template to the BDM chart organizer found here.
It's an exceptional tool... ALL your alerts will then work monitoring ALL 28 pairs.
Still manual but you will be LIGHT YEARS ahead of where you are now.
Hi Guys, im hoping you maybe able to help me complete this system i been working on basically its hurst cycles using indicator FastTMALine the rules are inner band has to be close to outer band price willbe to the edge if not thre the bands to extreme price into supply demand zone centreline colour in direction of trade tmaslope above or below 0 line (bullish or bearish) stochastics overbought/oversold alerts are on price entering supply demand zone and fasttmaline centreline change ideally guys would be nice if all 28 pairs could be monitored on...
Ignored
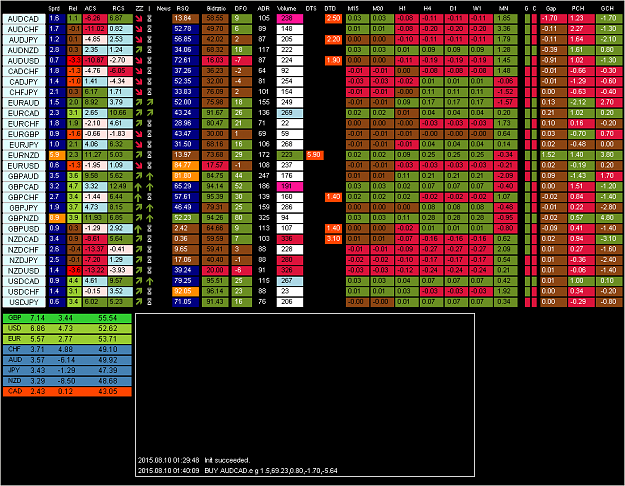
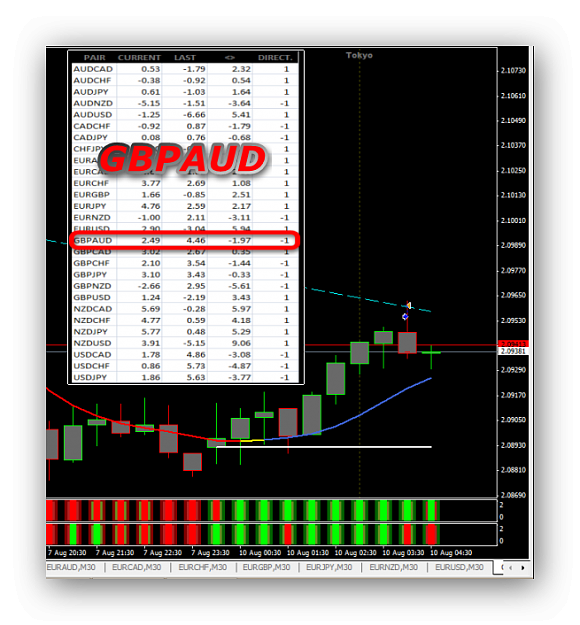
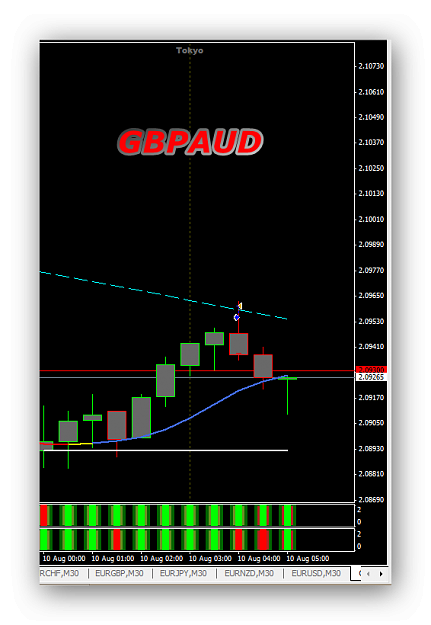
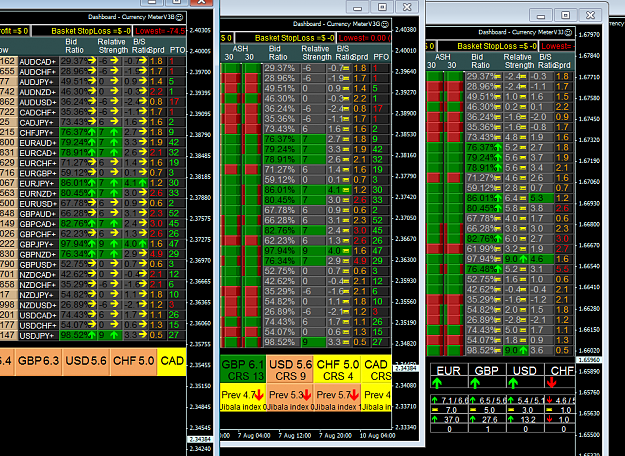
Quite interesting idea, we can try that. How much you have used/tried that system? I just need to do some modifications to that s&d indicator to get reliably distances to s&d-zones. I tested it with my own db (DTS and DTD) and it's not working the way that it could be used like that. And what's the exit strategy?
{quote} Quite interesting idea, we can try that. How much you have used/tried that system? I just need to do some modifications to that s&d indicator to get reliably distances to s&d-zones. I tested it with my own db (DTS and DTD) and it's not working the way that it could be used like that. And what's the exit strategy? {image}
{quote} Quite interesting idea, we can try that. How much you have used/tried that system? I just need to do some modifications to that s&d indicator to get reliably distances to s&d-zones. I tested it with my own db (DTS and DTD) and it's not working the way that it could be used like that. And what's the exit strategy? {image}
Ignored
Nice looking dashboard you have made . Will you ever release it to this thread ?
{quote} Quite interesting idea, we can try that. How much you have used/tried that system? I just need to do some modifications to that s&d indicator to get reliably distances to s&d-zones. I tested it with my own db (DTS and DTD) and it's not working the way that it could be used like that. And what's the exit strategy? {image}
Ignored
2 things1. You will notice s and d zones depth is made by the first candle2.if you got entry with the 2 channels centreline both being eg green....exit can be both being red.altho with in that simple entry exit you can have different method....eg trade long ...exit wait for pull back then long again
{quote} so... is it 'corrected' in Ultimate only... or our Meter dash also? Dumb question. of course you will correct. EXCELLENT! ----------------------------- and (as GVC points out) TIP: Yes. Use the DAILY chart to 'view' the RgH/RgL projections because When you view in the lower tf's.... it 'works' until it 'doesn't'.... meaning When the price SOARS far past the 'projections' it turns the indicator on its 'head' for that extreme pair... and the calculated Red/Green 'lines' become WAY off. The D1 view allows indy to show correct...
Ignored
GE, So you are looking at Daily chart rather lower TF. Excellent.
{quote} so... is it 'corrected' in Ultimate only... or our Meter dash also? Dumb question. of course you will correct. EXCELLENT! ----------------------------- and (as GVC points out) TIP: Yes. Use the DAILY chart to 'view' the RgH/RgL projections because When you view in the lower tf's.... it 'works' until it 'doesn't'.... meaning When the price SOARS far past the 'projections' it turns the indicator on its 'head' for that extreme pair... and the calculated Red/Green 'lines' become WAY off. The D1 view allows indy to show correct...
Ignored
RH and RL donot change its range values either your are looking on H1,H4 or Daily chart.
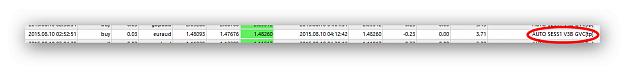
{quote} at this point and you post V3B . . . ???? V3B, V3G, V3J {image}
Ignored
They are both running on 1 mt4, same account. GVC V3B has the same algo implemented as HP V3J and as filters currently I use BR, RS & BSR only. Just to compare and for testing purpose. On GVC V3B I additional try manual reversals.
Jibala
PDF & BCC (Patience Discipline Focus & Belief Confidence Consistency)
so... is it 'corrected' in Ultimate only... or our Meter dash also?
Ignored