Hi Likica, I have a question about support and resistance
You say to make sure if you are taking a counter trend trade from a good support or resistance level ...but can the ema's be used as support and resistance in that regard?
I think I saw you once use the 200 ema as resistance to take a trade off, but what about the 50ema and the 10ema? and what about combining timframes,
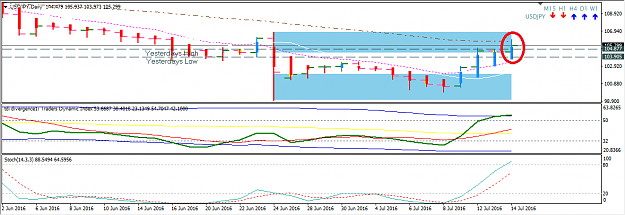
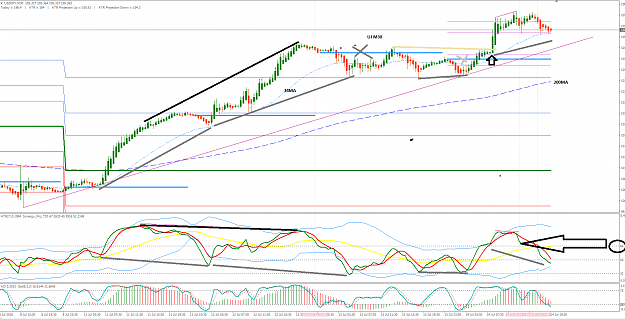
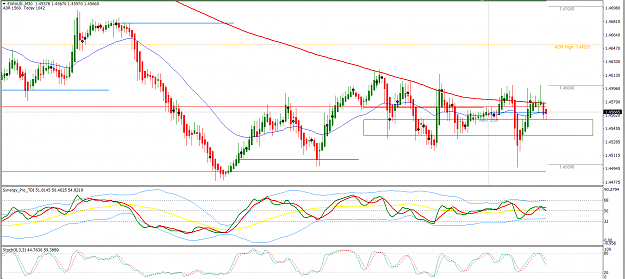
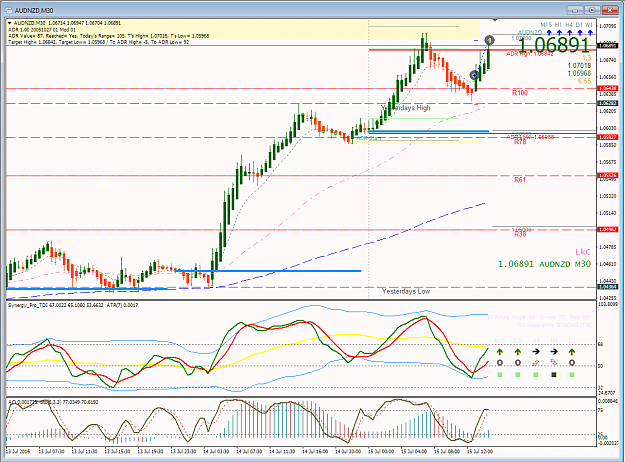
in the first image attached is usd/jpy on the daily chart. the brown dotted line is the 50ema, we can see price bouncing on it.
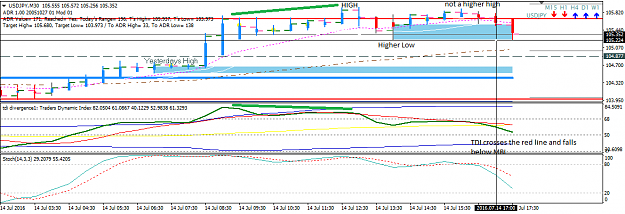
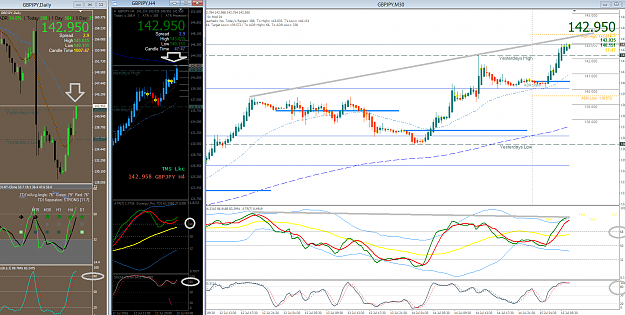
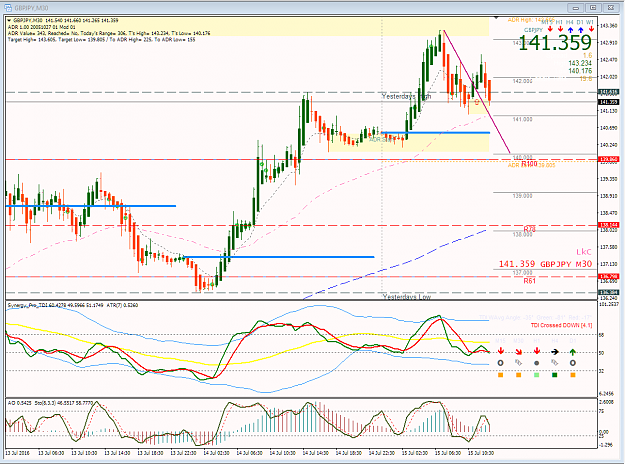
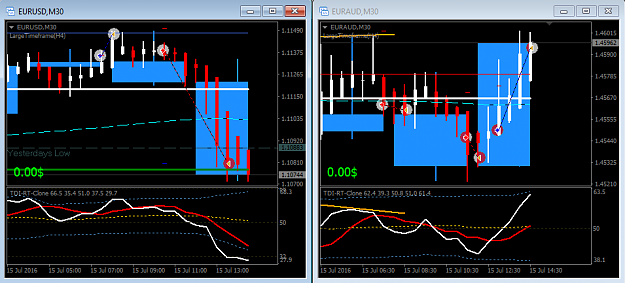
the second image is the usd/jpy m30 taken the same time as the first image, we can see divergance of price and tdi, we can see price not making higher highs, then we can see tdi crossing downwards and just dipping below the yellow mbl. I have no idea if opening a short at that point would be a good idea, ....so i am asking your expert opinion ....can we we use ema's like the 50 ema as support on m30 if it is coming from a higher timeframe????
thanks
at the moment the trend still looks quite bullish i have noticed.
but then again, i have seen you take counter trades when the trend looks still bullish.
i know a higher low, lower high and higher low is a sign of bears ...but sometimes if you wait that long price has gone too far to get good RR,
I know that big bull ABP's and small red APB's are a sign of bulls still in control, but often when i look at your counter trades [shorts] it looks like bulls still in control at time of entry.
I am wondering if a lower high, and then tdi cross below/near mbl is a sign bears are ready
sorry for the questions but this has been puzzling me slightly.
I don't want to short if bears are not ready, but bears do not speak, so we have to try see clue's ..
You say to make sure if you are taking a counter trend trade from a good support or resistance level ...but can the ema's be used as support and resistance in that regard?
I think I saw you once use the 200 ema as resistance to take a trade off, but what about the 50ema and the 10ema? and what about combining timframes,
in the first image attached is usd/jpy on the daily chart. the brown dotted line is the 50ema, we can see price bouncing on it.
the second image is the usd/jpy m30 taken the same time as the first image, we can see divergance of price and tdi, we can see price not making higher highs, then we can see tdi crossing downwards and just dipping below the yellow mbl. I have no idea if opening a short at that point would be a good idea, ....so i am asking your expert opinion ....can we we use ema's like the 50 ema as support on m30 if it is coming from a higher timeframe????
thanks
at the moment the trend still looks quite bullish i have noticed.
but then again, i have seen you take counter trades when the trend looks still bullish.
i know a higher low, lower high and higher low is a sign of bears ...but sometimes if you wait that long price has gone too far to get good RR,
I know that big bull ABP's and small red APB's are a sign of bulls still in control, but often when i look at your counter trades [shorts] it looks like bulls still in control at time of entry.
I am wondering if a lower high, and then tdi cross below/near mbl is a sign bears are ready
sorry for the questions but this has been puzzling me slightly.
I don't want to short if bears are not ready, but bears do not speak, so we have to try see clue's ..
Attached Image(s) (click to enlarge)