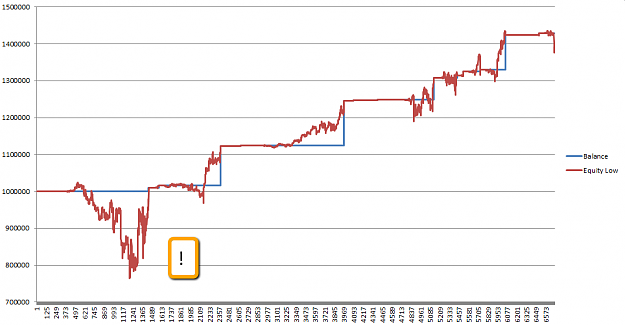
Well, very often, usualy for nice looking(?) martingale systems balance curve is appealing, but run on the live account it turn out that most of the time we are one step from disaster.
One of the shortcomings of the mt4 is that we can't get real equity curve with it.
We thought that it would be nice to see real drawdown anyway. In the attachement there is an EA which can do exactly that, however it requires some effort.
1. First of all it is necessary to run EA which we would like to test as usual and then save the statement.
2. Next you copy results to excel (without headings).
3. Filter out all order types except: buy, sell, close, close at stop, s/l, t/p.
3. Delete first column with trade index and all the columns after the volume column.
4. Change all "s/l", "t/p" to "close". "close at stop" can be as it is.
5. Your file should look like this (you can check testFile as an example, but it won't work if you run EA with this file):
2014.01.23 21:00 sell 1 1.00
2014.01.24 12:27 sell 2 2.00
2014.01.28 07:12 close 2 2.00
2014.01.28 07:12 close 1 1.00
6. Save this file as csv and move to mt4 > tester > files
7. Run our EA, it should should be clear how to setup it (but don't hestistate to PM us). Of course you should use the same period and symbol as you have used for your real EA.
8. In the mt4 > tester > files should appear new csv file which consist of equity and balance data saved with given interval. You can separate colums with excel functions (in data tab).
We tested it on different platforms, but we are not sure if it is roboust enough to work everytime.
If everything is ok, you end up with good data for further analysis!
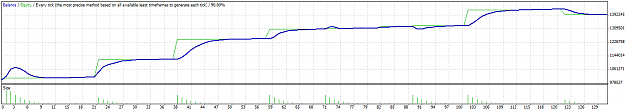
You can check comparision of balance curve from mt4 and equity curve from test.
One of the shortcomings of the mt4 is that we can't get real equity curve with it.
We thought that it would be nice to see real drawdown anyway. In the attachement there is an EA which can do exactly that, however it requires some effort.
1. First of all it is necessary to run EA which we would like to test as usual and then save the statement.
2. Next you copy results to excel (without headings).
3. Filter out all order types except: buy, sell, close, close at stop, s/l, t/p.
3. Delete first column with trade index and all the columns after the volume column.
4. Change all "s/l", "t/p" to "close". "close at stop" can be as it is.
5. Your file should look like this (you can check testFile as an example, but it won't work if you run EA with this file):
2014.01.23 21:00 sell 1 1.00
2014.01.24 12:27 sell 2 2.00
2014.01.28 07:12 close 2 2.00
2014.01.28 07:12 close 1 1.00
6. Save this file as csv and move to mt4 > tester > files
7. Run our EA, it should should be clear how to setup it (but don't hestistate to PM us). Of course you should use the same period and symbol as you have used for your real EA.
8. In the mt4 > tester > files should appear new csv file which consist of equity and balance data saved with given interval. You can separate colums with excel functions (in data tab).
We tested it on different platforms, but we are not sure if it is roboust enough to work everytime.
If everything is ok, you end up with good data for further analysis!
You can check comparision of balance curve from mt4 and equity curve from test.
Attached Image (click to enlarge)
Attached Image (click to enlarge)
Attached File(s)
Check CaterpillarFX