DislikedIMPORTANT : The MA Dashboard has similar features to the Stoch Dashboard and can be dragged around the chart the same way. 1/ The Display can show a single color for when price is inside the MA distance Channel or it can display 2 colors which shows if the Price is inside the upper or lower section of the MA distance Channel. 2/ The Alerts can be set by activating select Timeframes out of the inputs list and when all those Timeframes meet the Signal criteria then the Alerts will fire. 3/ The Alerts can also be set by selecting a number of Timeframes...Ignored
In your second setting - 2 colours once you're above or below MA channel:
I get different results when I change instruments (but for all instruments)
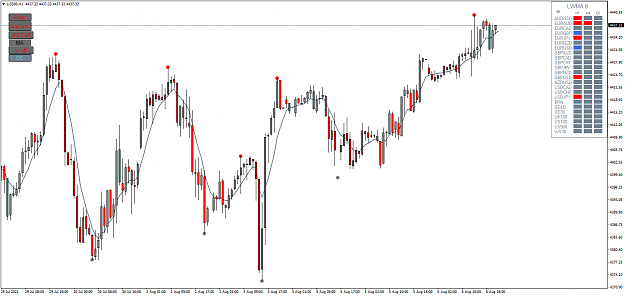
on BRN, Gold, GE30, UK100, US100, US500 I get what you see in screenshot 1
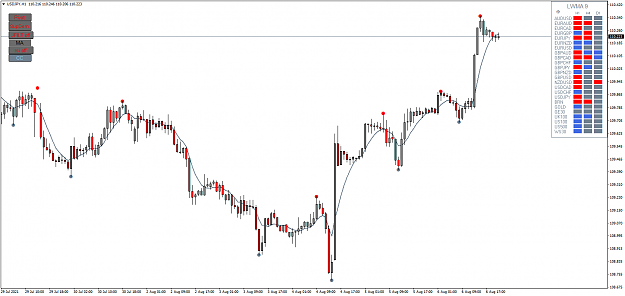
for all the other instruments I get what you see in screenshot 2.
The strange thing is - the wider you make the channel (say 100 pips instead of 10) the more are above or below MA.
But actually you want to know whether price-candle closed above or below MA.
Do you think you could check that?
(If you have another go at it: do you think you could add extra input for the colour of chosen instrument; so it is displayed in the dashboard in a different colour?)
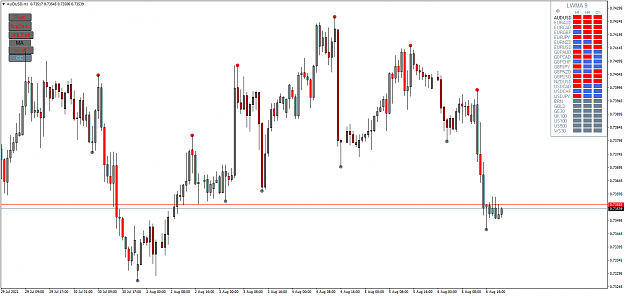
MA price dashboard v1 seems to have better signal but has no signal for:
BRN, GOLD, GE30, UK100, US100, US500, WS30 (screenshot 3)
But it really shouldn't be a problem - MA cross
Attached Image(s) (click to enlarge)