Hi.
I started school this year after 4 years working, I started to look into forex again but quite a bit more serious than last time.
The reason for entering the market again are more than just cash, of cours I would love to be able to make some extra from my savings to enjoy life as student, but more important I find it pretty interesting to watch those candles fly trying to find logics, mostly understand logics as I doubt I will ever find a logic who someone else hasnt found.
I find it interesting to keep my ears open for fundamentals and see how the financial market respond to it.
The problem is that im enjoying it to much and most of all i want to sit in front of my screen watching for short term opportunities, but as we all know that is quite time consuming, also the market is making alot of noise in those low timeframe. 1m and 5m is my favourite, I found 15min to erase alot of noise and still it is quite interesting.
But to be honest, i have not been profitable in those timeframes and are probably rushing through some entries to early, I would be able to perform better but trying to combine with homework makes it hard.
The major problem is that I paid more attention to the marked that to my study and that needs to end it is quite alot to do as a engineer student! Still I want to analyse the market, but if i move to 1hr, 4hr or even daily I would spend alot less time analyzing those candles, and the need to check so often dissapere a bit.
So back to my question, im searching a high timeframe trading stratgy which has worked for you.
Ofcourse I can search and read, im not afraid of spending hours studying new strategies and i do, but it will take forever as ther are tons of strategies so im looking for contribution to a nice base where i can start from.
I am attaching current chart for my newly formed template which I have been testing for a day with decent results, but it has lacks of rules and im doing entrys based on thoughts which might not be preferable.
There is nothing fancy and all indicators are original MT4 indicators.
EMA 30 (yellow) this acts as pullback resistance for high momentum trending market condition.
EMA 89 (blue) this acts as second resistance in trending market for stron pullbacks, my SL always under this EMA
EMA 200 (green) average trend strength, also nice to identify trending market, if EMA 200 cross both EMA89 and EMA 30 this indicates change in major trend.
BBand Period 30 Deviations 2, This helps me identify possible breakouts, aswell as when a pullback in ranging market are about to accur, if the BBand is more or less a straight channel and price break upper or lower band im looking to exit any trades as this strongly suggest pullback to eith middle line or opposite band, it is also good to get a indication of momentum in a trend, if the prices pull back, but dont cross middle EMA it is nice pressure in trend direction.
im using williams Perscent indicator with period 10 to identify overbought and oversold conditions, however im not blindly entering on overbought or oversold, this indicator do also help me to analyse momentum, if the %r crosses from beneth but do not cross middle line before turning down again stron momentum down and vica versa.
I use MACD to spot possible reversals together with candle patterns, MACD divergence to be concrete.
I started school this year after 4 years working, I started to look into forex again but quite a bit more serious than last time.
The reason for entering the market again are more than just cash, of cours I would love to be able to make some extra from my savings to enjoy life as student, but more important I find it pretty interesting to watch those candles fly trying to find logics, mostly understand logics as I doubt I will ever find a logic who someone else hasnt found.
I find it interesting to keep my ears open for fundamentals and see how the financial market respond to it.
The problem is that im enjoying it to much and most of all i want to sit in front of my screen watching for short term opportunities, but as we all know that is quite time consuming, also the market is making alot of noise in those low timeframe. 1m and 5m is my favourite, I found 15min to erase alot of noise and still it is quite interesting.
But to be honest, i have not been profitable in those timeframes and are probably rushing through some entries to early, I would be able to perform better but trying to combine with homework makes it hard.
The major problem is that I paid more attention to the marked that to my study and that needs to end it is quite alot to do as a engineer student! Still I want to analyse the market, but if i move to 1hr, 4hr or even daily I would spend alot less time analyzing those candles, and the need to check so often dissapere a bit.
So back to my question, im searching a high timeframe trading stratgy which has worked for you.
Ofcourse I can search and read, im not afraid of spending hours studying new strategies and i do, but it will take forever as ther are tons of strategies so im looking for contribution to a nice base where i can start from.
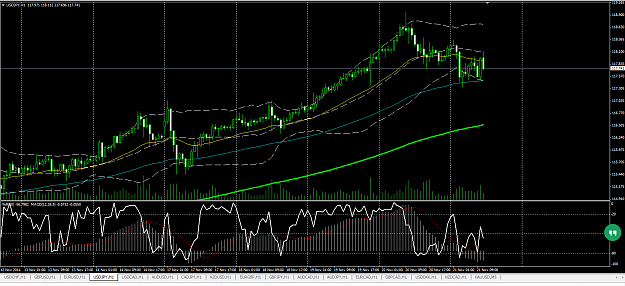
I am attaching current chart for my newly formed template which I have been testing for a day with decent results, but it has lacks of rules and im doing entrys based on thoughts which might not be preferable.
Attached Image (click to enlarge)
There is nothing fancy and all indicators are original MT4 indicators.
EMA 30 (yellow) this acts as pullback resistance for high momentum trending market condition.
EMA 89 (blue) this acts as second resistance in trending market for stron pullbacks, my SL always under this EMA
EMA 200 (green) average trend strength, also nice to identify trending market, if EMA 200 cross both EMA89 and EMA 30 this indicates change in major trend.
BBand Period 30 Deviations 2, This helps me identify possible breakouts, aswell as when a pullback in ranging market are about to accur, if the BBand is more or less a straight channel and price break upper or lower band im looking to exit any trades as this strongly suggest pullback to eith middle line or opposite band, it is also good to get a indication of momentum in a trend, if the prices pull back, but dont cross middle EMA it is nice pressure in trend direction.
im using williams Perscent indicator with period 10 to identify overbought and oversold conditions, however im not blindly entering on overbought or oversold, this indicator do also help me to analyse momentum, if the %r crosses from beneth but do not cross middle line before turning down again stron momentum down and vica versa.
I use MACD to spot possible reversals together with candle patterns, MACD divergence to be concrete.