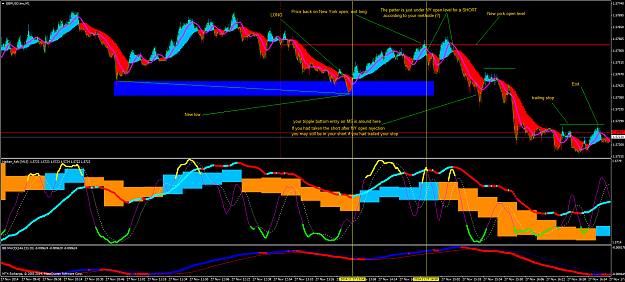
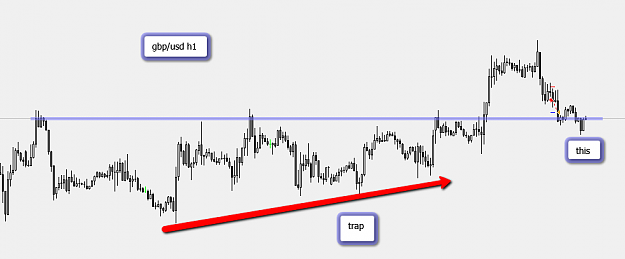
{quote} Here you go. Please don't mind the indicators. Price is the green line chart. Heiken Hashi in the background. Hope it makes it clearer. Cheers! {image}
Ignored
Ok now i understand, yes the price made some small double tops (where you signaled a short entry), and then down from there.
At the time i was babysitting the eurusd trade, however the more you look the more you see signals (double tops, double bottoms) everywhere, on every timeframe, all the time.
We pick the ones that looks nice, sometime they give a perfect profitable trade sometime the trade don't go as planned, i think the most important thing here is to just enter a trade when we are really confident on the strong validity of the situation, when the situation is very clear, you know what i mean.
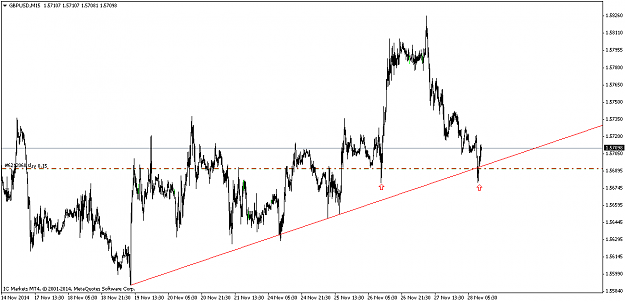
Like, this last gbpusd buy trade i made it wasn't a good one, first of all, the time, ny session during an usa holiday (no liquidity), the chances of price to go up again to the tops of the day and above are almost 0.
It is different than a trade taken at london open, when the real stuffs happens.
You see i lack of discipline, and i think to have some trading addiction problem, so i do this kind of stupid trades very often, and most of the time they give losses.
This is really an interesting thing, i think about it so rarely, thank you for let me focus on that today.
And by the way i think 99% of traders (at least the ones who manage their own money) do develop a trading addiction problem, it is a problem of all of us.
To sum up, the only way i know to effectively manage risk is to make good trades, stay focused, and discipline!
I am not a good example in that, i don't care about make mistakes, and actually each of them teach us something new (not always new, lol), you need to try many (the more the better) wrong ways in order to discover the right ways.
However we must agree that the best thing to do in order to make money is take only the good trades, and avoid the "i'm not sure, let's try" kind of trades.
If you do that, and you have a decent system, 90% of your trades will be really profitable.
And when a trade is wrong, take the loss and move on to the next profitable trade!
Lol... You are very welcome.
I agree about the addiction problems to trading it's probably true.
When you take a good trade it can go well or not. But when you take a "bad" trade, I mean a trade where you just jump in our don't respect your rules, it seems to always go wrong...
Quote Tunera 'You see i lack of discipline, and i think to have some trading addiction problem, so i do this kind of stupid trades very often, and most of the time they give losses'.
Isnt this the price of trading a set of 'principles' with the benefit of flexibility that provides, versus trading with a rigid set of 'rules' with no flexibility. A rigid set of rules provides the opportunity for discipline wheras a set of principles with few rules are much more likely to be flexibly interpreted and open up the possibility of miscalculation. With rigid rules might come more discipline but you also might throw the baby out with the bath water.
PS. I love your principles and this thread and all the contributors to it. Keep it going.
{quote} This thread does not belong iin the trading section ? This is how I handle "the knife" 1) I know the price should stall at 129.50 (order flow appearing at this exact price) {image} 2) ... more order flow same level {image} 3) Break even at this point then I don't care ... {image}
Ignored
Mingary, for me your chart nice and interesting.
If you don't mind, can you tell me more?
1. how you can read there are "more order flow same level"?
2. what indicator and band on chart what meaning and how to use them to detect "high/low"?
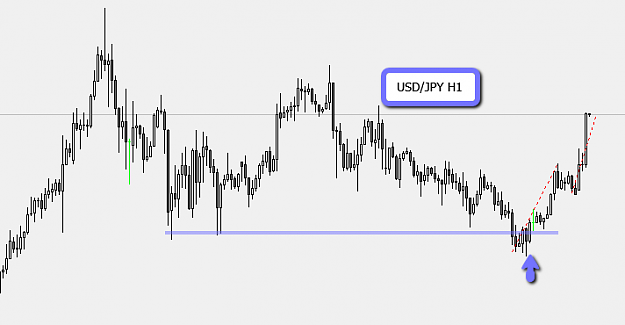
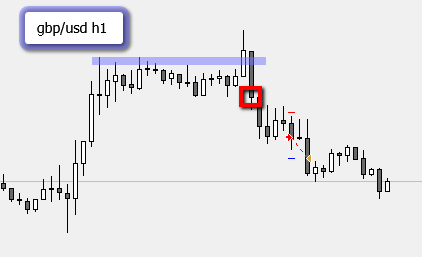
USD/JPY H1 very nice set up last night. {image} Took GBP/USD H1 last night using other method. Just noticed that the red box would have been a much better spring-pattern entry. {image}
Quote Tunera 'You see i lack of discipline, and i think to have some trading addiction problem, so i do this kind of stupid trades very often, and most of the time they give losses'. Isnt this the price of trading a set of 'principles' with the benefit of flexibility that provides, versus trading with a rigid set of 'rules' with no flexibility. A rigid set of rules provides the opportunity for discipline wheras a set of principles with few rules are much more likely to be flexibly interpreted and open up the possibility of miscalculation. With rigid...
Ignored
I like your view!
However, there is something very important we must consider here, and it is that the market is one of the most dynamic thing in the world, so the moment you adopt a strict set of static rules (i'm talking about a typical "real" mechanical hard-rules trading system) on a dynamic market, things will not work well.
With this i just mean that to me the concept of "principles" (buy low sell high) and the dynamism of the rules (look for momentum slowdown and a double top/bottom pattern) are a good thing.
What is lacking on this system, as you probably meant, are major rules regarding discipline.
Last year for example, i used to respect a rule that say "max 1 trade per day", this mean only 1 trade in the whole day, so no hurry, look all the pairs all the tf, choose the best one, keep it open untill the technical profit target has been reached, you know.. just some serious trading.
Life is dynamic too, everything change with time, and i see now how much discipline i lost in this last year, these last few posts has been really an eyes opener to me, i'm glad to have opened this thread.
So.. i'm going to recover some of my lost discipline from now on, i can share some personal rules i thought:
1) Trade no more than one pair per time.
2) Don't open new trades after london has closed.
3) No hurry.
I think these are the sort of rules that the system was lacking of.
{quote} Mingary, for me your chart nice and interesting. If you don't mind, can you tell me more? 1. how you can read there are "more order flow same level"? 2. what indicator and band on chart what meaning and how to use them to detect "high/low"? Thank you TB
Ignored
Hi,
This is how I explain it:
Visualize a yoyo. The yoyo rolls down, at the end of the move there is a sudden tension in the string; the yoyo "spins on itself for a few seconds" and then goes back up. This "spin on itself for a few seconds" - applied to a price move - is what I call Order Flow.
The indicator is a TMA band to detect "extremes". I had to create the "order flow indicator" because there was not one...
{quote} Hi, This is how I explain it: Visualize a yoyo. The yoyo rolls down, at the end of the move there is a sudden tension in the string; the yoyo "spins on itself for a few seconds" and then goes back up. This "spin on itself for a few seconds" - applied to a price move - is what I call Order Flow. The indicator is a TMA band to detect "extremes". I had to create the "order flow indicator" because there was not one...
Ignored
Thank you Mingary, yes I got it.
Your "order flow indicator" interesting for me because
I am a big fan of volume indicator and stuff like that, and this topic thread of course.
Wish you have great luck and success with your own "order flow indicator".
quote tunera I like your view! However, there is something very important we must consider here, and it is that the market is one of the most dynamic thing in the world, so the moment you adopt a strict set of static rules (i'm talking about a typical "real" mechanical hard-rules trading system) on a dynamic market, things will not work well.................
The interplay of Fear and Greed, the essence of the human condition. Bought into extreme focus in the crucible of trading Forex. The optimum mental state to be in when trading is ( to quote Krishnamurti), 'I don't mind what happens'. The outcome is secondary. Trading devoid of fear and greed, well versed in your principles, your strategy, being totally in present time executing your principles and strategy delivers the optimum chance of success for any proven strategy. Fear and greed derail the most promising systems if allowed to influence the mind of its practitioner. The real problem is the fear involved in adopting the mindset 'not minding what happens', overcome that and you can walk on water as an enlightened one and you wont need to trade forex anymore.
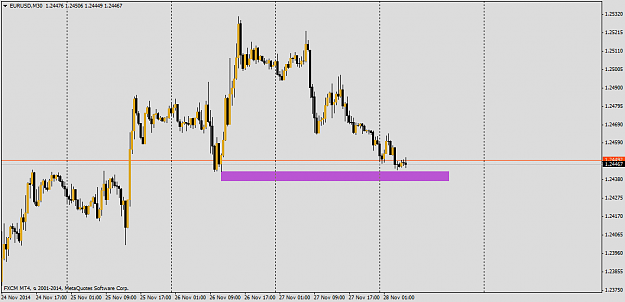
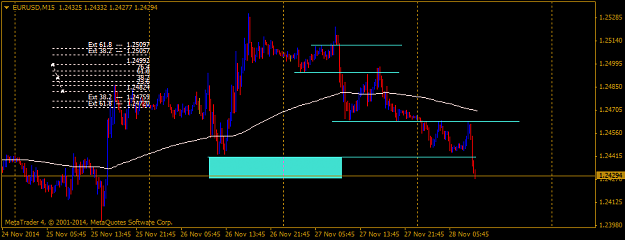
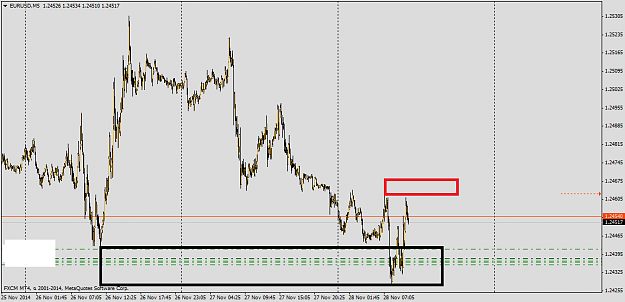
I would wait at least to 1.24625 level to be broken, then let's see what happen after such break (price relax and get down again, or start going up seriously).
Looking at the lack of fundamental news today it's hard to belive that we'll see some big action, however.. this is friday, and the last day of the month, crazy things can happen.
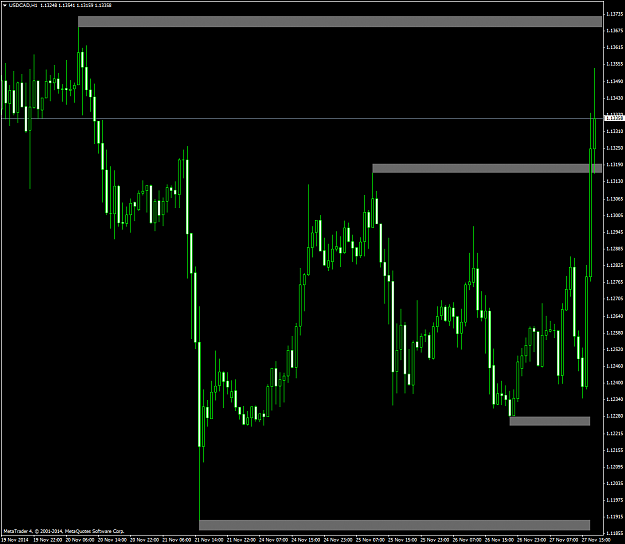
{quote} I would wait at least to 1.24625 level to be broken, then let's see what happen after such break (price relax and get down again, or start going up seriously). Looking at the lack of fundamental news today it's hard to belive that we'll see some big action, however.. this is friday, and the last day of the month, crazy things can happen. Edit: image below {image}
Ignored
1.24623 reached, stops at +1, and let's see if this want to go up from here.
Edit:
Na, i'm out at +27 pips, no more trades for the week
Edit2:
Fook, is going up like a train. Hopefully some bulls here are riding it