THE RECAP continued....
Commence with a clean chart in bar chart mode and pick an instrument that you would like to include in your portfolio. This technique applies to any of the following asset classes namely forex, indices (CFD's) or spot commodities. I can't say whether it works on equities and other asset classes simply as I haven't tested this technique on them but...... it appears evident that this technique is 'instrument agnostic' which is what you want with a robust durable trend trading strategy.
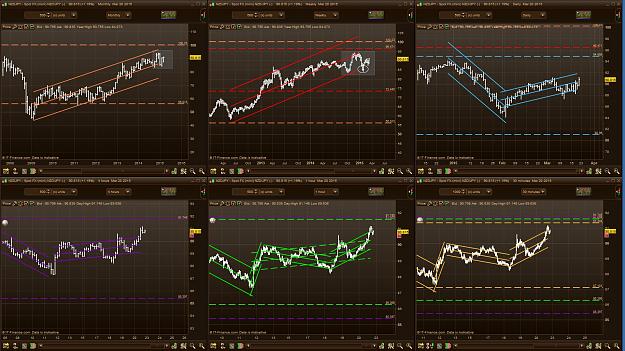
We will choose for this recap good ol' USDJPY....but in reality any would suffice but..... I have chosen this (in hindsight) as I know what the following recap will demonstrate and for the purposes of learning this technique we want to know how to trade a trend.....and we have a cracker in store for us. But remember....life is like a box of chocolates......you never know what you're gonna' get.
Just remember that this discussion will focus only on one instrument......keep in the back of your mind as we step through this that in a diversified portfolio you could be looking at over 20+ instruments. So speed of execution and decision making is going to be essential and for that, the correct platform for this technique 'really matters'.
Also remember this as we step through the recap. This is not an elegant trend following technique with exact lines and formal patterns that would be traditionally regarded as a trend. Such an approach is counter-productive in trading a diversified portfolio as you need a technique that is fast and identifies upwards or downwards price movement of significance...no matter what the pattern. This technique is one of brute force that works well in stochastic markets and cuts through any illusory pattern you may think exists, to deliver absolute returns by only focussing on the barest rudimentary pattern of all....and that is whether price is going up or down in a concerted and sustained effort that may deliver a 'real' trend of substance.
So a trend in this approach takes on a different form to that which traditional trend chartists may agree on. This is a no b...hit fast punch-through technique where considerable discretion is allowed for. We are not dealing with exactness ladies and gentlemen as this market exhibits significant random behaviour but what we are hoping for is that in this general random noise there perhaps is a 'sniff' of a kernel of co-ordinated price movement deep within the price pattern.
So don't worry about exact placements of channels and predictive entry points as these allow for considerable discretion. In managing a diversified portfolio, it pays dividends to not be too anal about things. All we want to ensure is that we participate in any significant price movement and therefore we are not too selective in how this directional price unfolds. As a trend trader who depends on directional price movement, we want to enjoy as many as practically possible as in the scheme of things this market tracks more sideways than it does in the vertical dimension. You just want to avoid where possible that damned sideways movement, or what I refer to as price congestion.
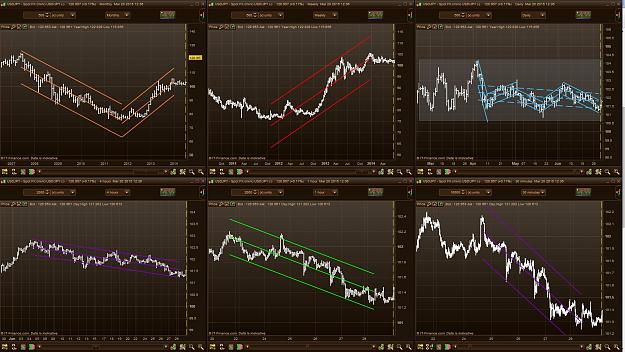
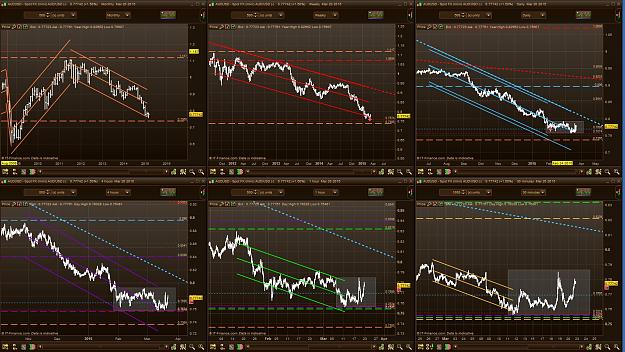
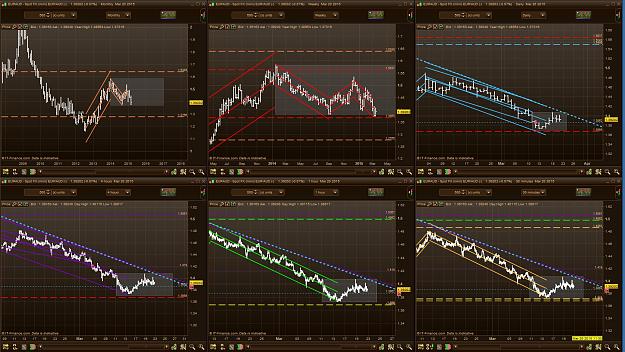
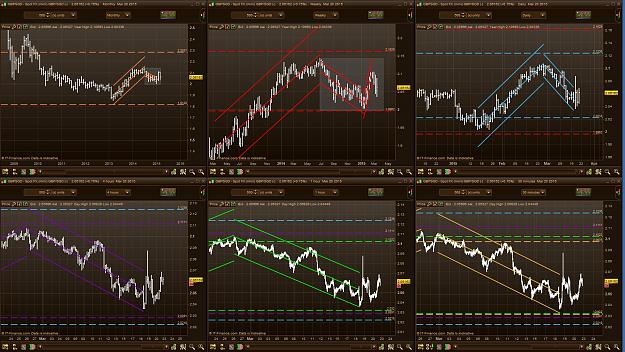
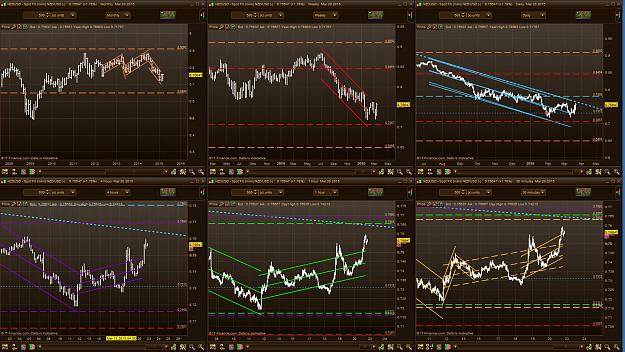
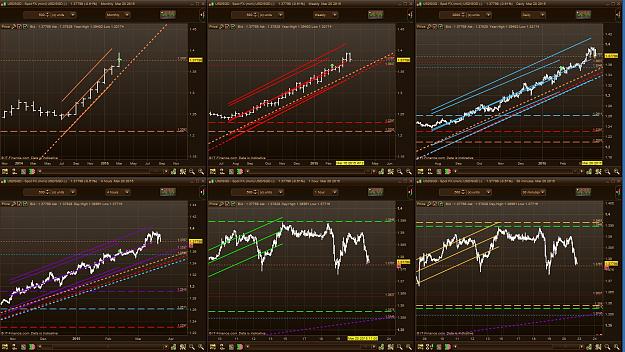
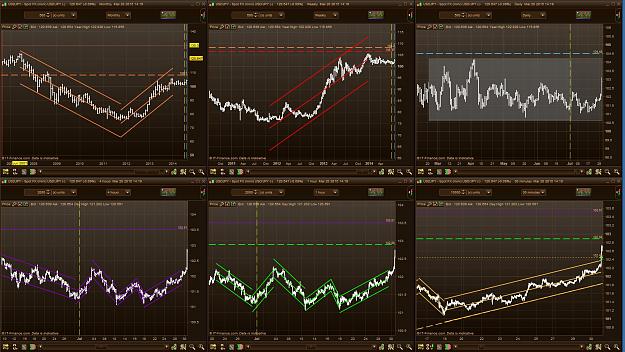
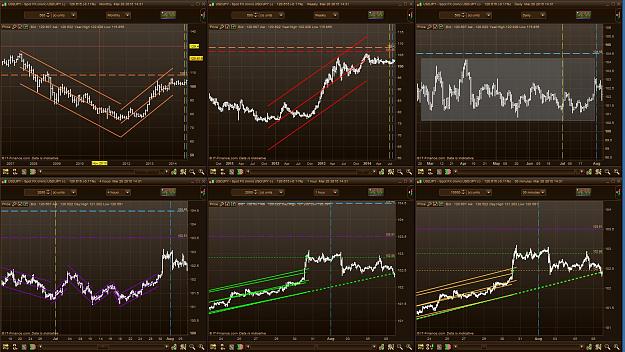
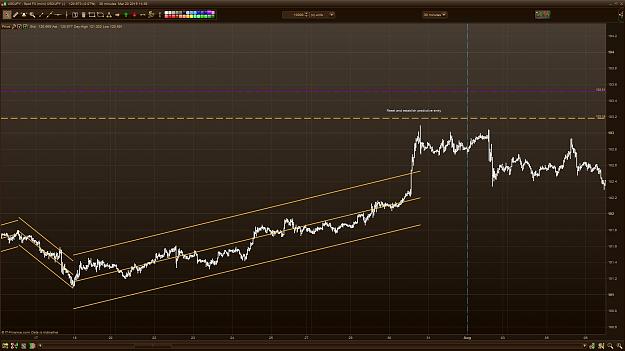
The recommended template for a proposed 'single' instrument is below.

Note the following:
1. Clean chart with only information made available that is helpful to this technique. Forget any other additions. It might make a less elegant chart and give the appearance of 'too simple to be practical'...but in essence that's just what we want. To be brutally honest, we could also be working just with line charts as opposed to bar charts as that really is all you need with this brutal technique.....but I personally prefer bar charts. Note that there are no candlestick charts. Their use is not a problem but their colour and the unnecessary information, that you won't use anyway for this technique, quickly gets these charts unnecessarily complicated and visually dificult to interpret. Speed in application is an absolute necessity in this technique, so please make it simple for yourselves.
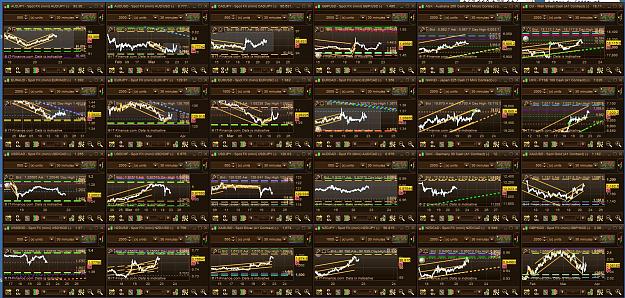
2. The timeframes we monitor are monthly (MN), weekly (W1), daily (D1), 4-hourly (H4), hourly (H1) and 30 minute (M30). You will need to develop a template for each instrument that allows you to quickly switch between them wihout recreation.....and if you have a portfolio watch-list like mine....there will be 24 templates...plus a summary template (which I will get to later). "Oh my god (I hear the cries)........that sounds too hard"......na, it's not, and familiarity over time makes management easier. One click and a new template is up. That's how it should be ladies and gents.
3. "What is that platform you are using"......ProRealTime
4. Why not MT4....... Personal preference but also because my preferred platform offers 'trade by chart' functionality and a very user-friendly interface...but this shouldn't stop you using MT4 if you prefer. This technique works on any platform offerring 'Standard Deviation Channels' but you need to ensure it 'works for you'. I find MT4 not as user friendly as ProRealTime, but that's just me....and I am a teapot anyway!!!!/ tic
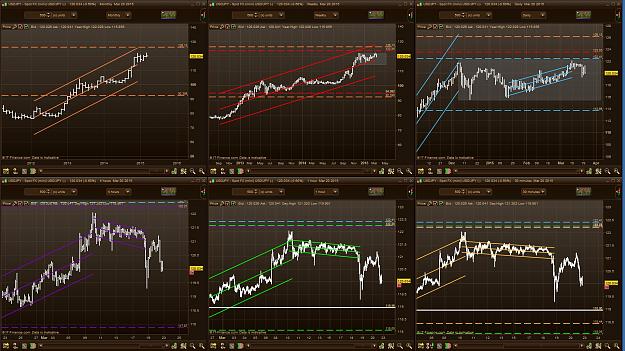
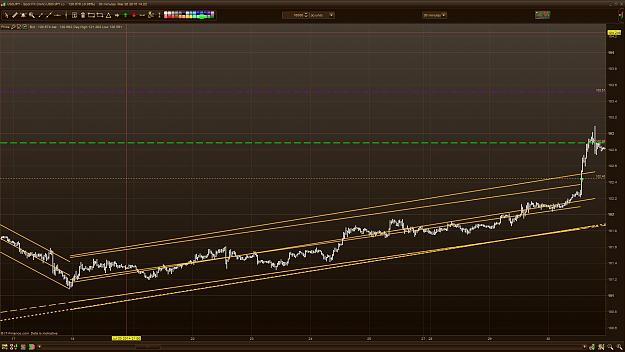
So now have a look back at the USDJPY template above. Before you do anything further, make an assessment visually of what timeframes are trending. I have synchronised all timeframes to be representative of a point in time in late June 2014. Get the feel of overall price movement.
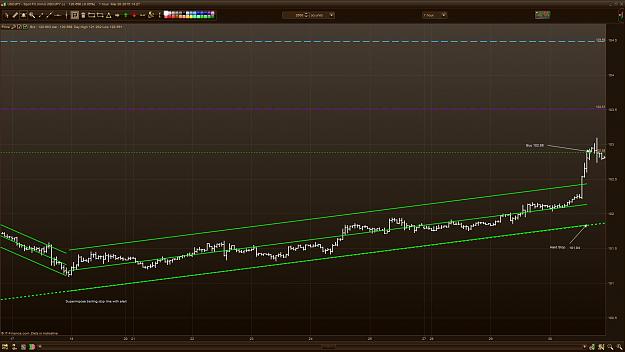
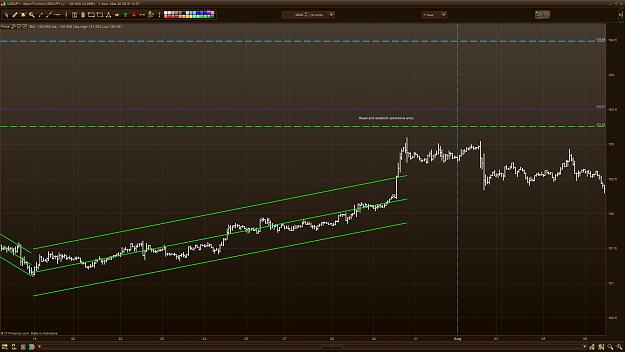
What we are going to do now is ensure we are all defining that price movement the same way, not by personal chart reading but by applying the only indicator you will use in this technique...being the Standard Deviation Channel (SDC). By using this device, we ensure we are all 'see' the same thing with price movement. This avoids any subjective judgement that may be deceiving you.
Next post..applying the SDC to reflect a possible order that exists in this chaos that we can all agree on.
C
Commence with a clean chart in bar chart mode and pick an instrument that you would like to include in your portfolio. This technique applies to any of the following asset classes namely forex, indices (CFD's) or spot commodities. I can't say whether it works on equities and other asset classes simply as I haven't tested this technique on them but...... it appears evident that this technique is 'instrument agnostic' which is what you want with a robust durable trend trading strategy.
We will choose for this recap good ol' USDJPY....but in reality any would suffice but..... I have chosen this (in hindsight) as I know what the following recap will demonstrate and for the purposes of learning this technique we want to know how to trade a trend.....and we have a cracker in store for us. But remember....life is like a box of chocolates......you never know what you're gonna' get.
Just remember that this discussion will focus only on one instrument......keep in the back of your mind as we step through this that in a diversified portfolio you could be looking at over 20+ instruments. So speed of execution and decision making is going to be essential and for that, the correct platform for this technique 'really matters'.
Also remember this as we step through the recap. This is not an elegant trend following technique with exact lines and formal patterns that would be traditionally regarded as a trend. Such an approach is counter-productive in trading a diversified portfolio as you need a technique that is fast and identifies upwards or downwards price movement of significance...no matter what the pattern. This technique is one of brute force that works well in stochastic markets and cuts through any illusory pattern you may think exists, to deliver absolute returns by only focussing on the barest rudimentary pattern of all....and that is whether price is going up or down in a concerted and sustained effort that may deliver a 'real' trend of substance.
So a trend in this approach takes on a different form to that which traditional trend chartists may agree on. This is a no b...hit fast punch-through technique where considerable discretion is allowed for. We are not dealing with exactness ladies and gentlemen as this market exhibits significant random behaviour but what we are hoping for is that in this general random noise there perhaps is a 'sniff' of a kernel of co-ordinated price movement deep within the price pattern.
So don't worry about exact placements of channels and predictive entry points as these allow for considerable discretion. In managing a diversified portfolio, it pays dividends to not be too anal about things. All we want to ensure is that we participate in any significant price movement and therefore we are not too selective in how this directional price unfolds. As a trend trader who depends on directional price movement, we want to enjoy as many as practically possible as in the scheme of things this market tracks more sideways than it does in the vertical dimension. You just want to avoid where possible that damned sideways movement, or what I refer to as price congestion.
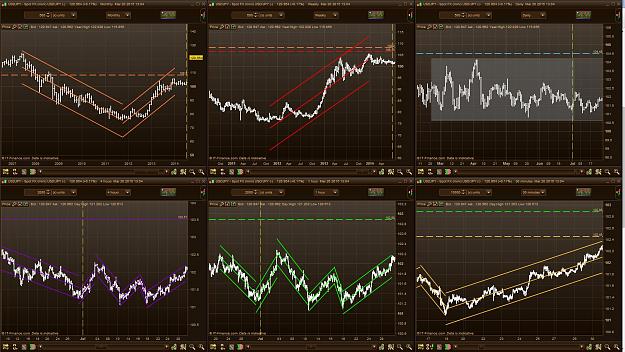
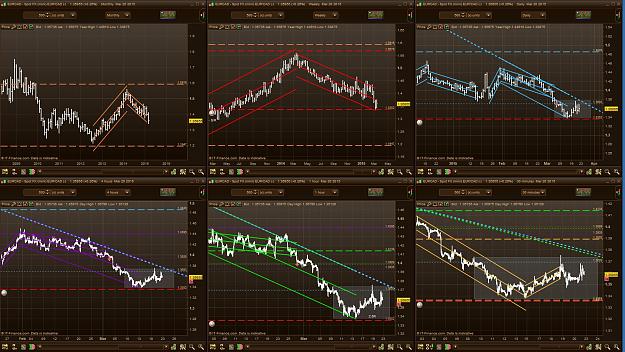
The recommended template for a proposed 'single' instrument is below.
Attached Image (click to enlarge)
Note the following:
1. Clean chart with only information made available that is helpful to this technique. Forget any other additions. It might make a less elegant chart and give the appearance of 'too simple to be practical'...but in essence that's just what we want. To be brutally honest, we could also be working just with line charts as opposed to bar charts as that really is all you need with this brutal technique.....but I personally prefer bar charts. Note that there are no candlestick charts. Their use is not a problem but their colour and the unnecessary information, that you won't use anyway for this technique, quickly gets these charts unnecessarily complicated and visually dificult to interpret. Speed in application is an absolute necessity in this technique, so please make it simple for yourselves.
2. The timeframes we monitor are monthly (MN), weekly (W1), daily (D1), 4-hourly (H4), hourly (H1) and 30 minute (M30). You will need to develop a template for each instrument that allows you to quickly switch between them wihout recreation.....and if you have a portfolio watch-list like mine....there will be 24 templates...plus a summary template (which I will get to later). "Oh my god (I hear the cries)........that sounds too hard"......na, it's not, and familiarity over time makes management easier. One click and a new template is up. That's how it should be ladies and gents.
3. "What is that platform you are using"......ProRealTime
4. Why not MT4....... Personal preference but also because my preferred platform offers 'trade by chart' functionality and a very user-friendly interface...but this shouldn't stop you using MT4 if you prefer. This technique works on any platform offerring 'Standard Deviation Channels' but you need to ensure it 'works for you'. I find MT4 not as user friendly as ProRealTime, but that's just me....and I am a teapot anyway!!!!/ tic
So now have a look back at the USDJPY template above. Before you do anything further, make an assessment visually of what timeframes are trending. I have synchronised all timeframes to be representative of a point in time in late June 2014. Get the feel of overall price movement.
What we are going to do now is ensure we are all defining that price movement the same way, not by personal chart reading but by applying the only indicator you will use in this technique...being the Standard Deviation Channel (SDC). By using this device, we ensure we are all 'see' the same thing with price movement. This avoids any subjective judgement that may be deceiving you.
Next post..applying the SDC to reflect a possible order that exists in this chaos that we can all agree on.
C