1st trade: Buying pressure but resulted in weak breakout.
2nd trade: DT, failure of upward momentum resulting in a false break to the upside, meaning price is most probable to go down. Should have allow it to run further. The reason I closed is because I expected momentum to fail (the impulsive move lower was not strong, this one looked stronger which made me a bit skeptical)
3rd trade: This was a risky trade. Took it off the SR area between 80 (swing) and 75 as signs of strength appeared. There was climactic action lower, stochs started a cycle up. Closed as price started to lose momentum.
Attached Image (click to enlarge)
I need to get more comfortable with letting my trades run...
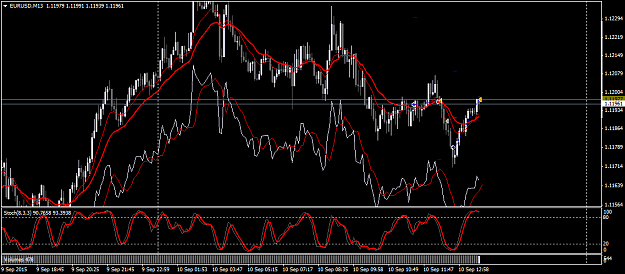
EU +25. Tick chart. 1st trade: Buying pressure but resulted in weak breakout. 2nd trade: DT, failure of upward momentum resulting in a false break to the upside, meaning price is most probable to go down. Should have allow it to run further. The reason I closed is because I expected momentum to fail (the impulsive move lower was not strong, this one looked stronger which made me a bit skeptical) 3rd trade: This was a risky trade. Took it off the SR area between 80 (swing) and 75 as signs of strength appeared. There was climactic action lower, stochs...
Great trading Dee, friska I should start paying more attention to the CSMs aswell; at least as a guideline. They seem to make you good pips friska.
Ignored
I think it is a valid help, at least to identify the forces at work.
but we must be careful to pullback especially on smaller TF, and not from reliable signals if the market is flat..
must learn to read it carefully and do not pounce on trade
{quote} nice MrC! you do not use often lines, right?
Ignored
What do you mean by lines?? support and resistance levels on the chart??
I did have triangles and levels marked on the chart but I cleared them. In my trades the only SR level used was the 75 - 80 zone and everyone can see that. I suppose the top limit of the range is another level in play at the 2nd trade but...I mainly watched price there.
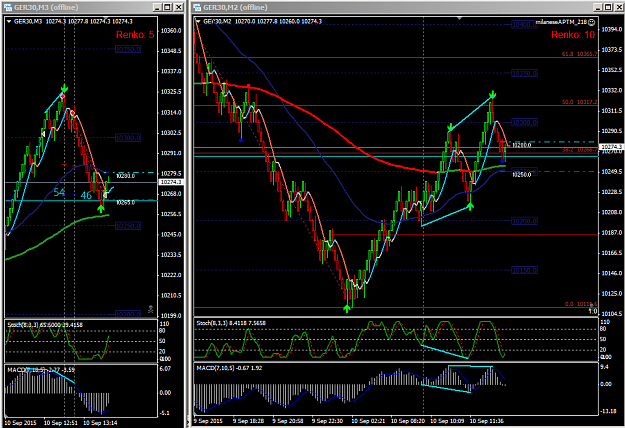
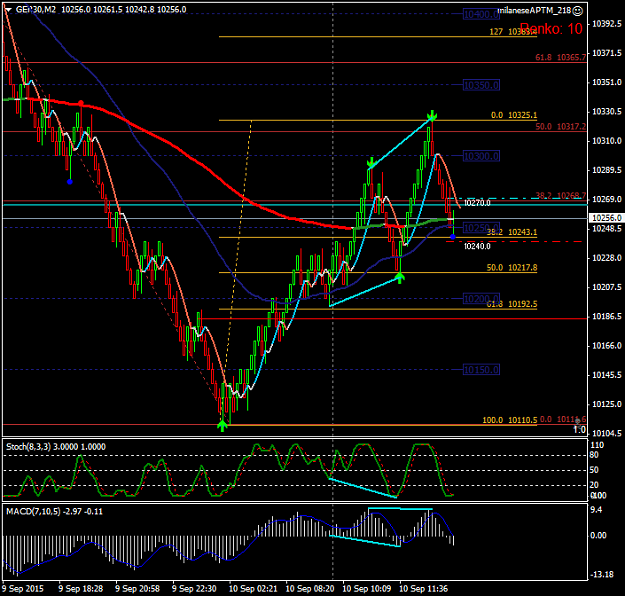
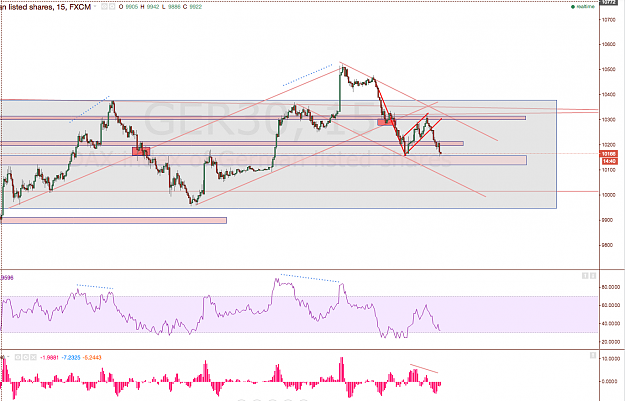
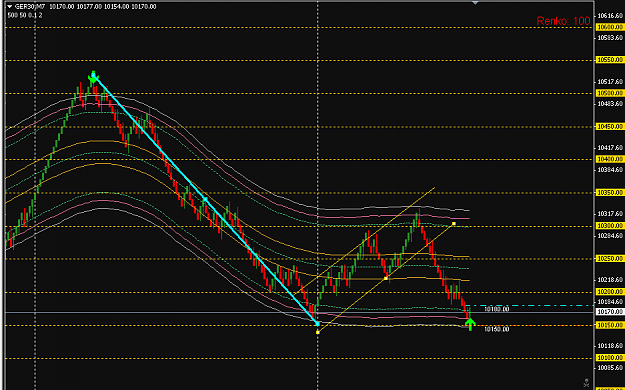
GER30 +54 +46. Divergence at HTF 50% on both 5 and 10 pip. Out at 38.2% and S&R. Pretty much the same as "Friska" we just saw the exit as some thing different but with the same result, that's trading
Both looking at the same thing, for example, I would opt for the one on the left but I think Friska would go for the one on the right although both do exactly the same thing.
{quote} The problem I have with Climatic Action is that it is extremely short lived and can happen quite unexpectedly!
Ignored
I use the term climactic action when price is becoming exhausted, the move becomes unsustainable. It's supposed to be short lived and to happen unexpectedly...that's how those who chase the market are attracted into losing positions.
Another way of looking at the exit zone, put a Fib on from Low to high and you get the 38.2% Retr confluence with the MAs and the BRN and if I was to draw a short term S&R line I could show that price stopped exactly there.
At some point you have to just go with what works for you because you can literally justify Price Action by using 101 different methods, you would have a real problem seeing the price action if you did use the 101 methods.
GER30 +54 +46. Divergence at HTF 50% on both 5 and 10 pip. Out at 38.2% and S&R. Pretty much the same as "Friska" we just saw the exit as some thing different but with the same result, that's trading Both looking at the same thing, for example, I would opt for the one on the left but I think Friska would go for the one on the right although both do exactly the same thing. {image} {image}
Ignored
V8 in Bentley is way to go. That sound!!
Great trading guys, really!
Btw. Dee what made you think about this? "Closed my long trade before it came back, pretty obvious it had run out of steam." Ok I know I don't have anywhere near the time you spent in front of charts. But What made you think about the running steam?
And just out of curiosity. What timeframe do you use for S/R ?
Coz I started pretty well. And now I'm lookin I made a zebra in my chart. Too many lines.
{quote} What do you mean by lines?? support and resistance levels on the chart?? I did have triangles and levels marked on the chart but I cleared them. In my trades the only SR level used was the 75 - 80 zone and everyone can see that. I suppose the top limit of the range is another level in play at the 2nd trade but...I mainly watched price there.
Ignored
I was referring to s/r zone or common patterns.
but it did not want to be a criticism of course!
I was just noticing how your charts were cleaned and very naked.
and you answered me between the lines..
{quote} I was referring to s/r zone or common patterns. but it did not want to be a criticism of course! I was just noticing how your graphics from TL were cleaned and very naked. and you answered me between the lines..
Ignored
I welcome criticism! And you have a point I should post complete charts. I'm in a trade right now...when I'll close it I'll post it on a chart with proper line studies.
Here it goes, trade is closed and overall I added +13 to my performance. Took three more scalps.
The chart looks pretty messy, hope you guys can understand. It's basic SRs and psychological levels. Keep in mind that I do not trade SR levels, but price. I look at how price behaves at SRs and considering the context or background or however you want to call it I take trades. Context, signals and SRs. No expectations, just what it is!
Attached Image (click to enlarge)
BTW, my charts may look slightly different from the previous post. That's because my tick chart indicator changes its configuration according to M5 volatility hour to hour.
GER30 +54 +46. Divergence at HTF 50% on both 5 and 10 pip. Out at 38.2% and S&R. Pretty much the same as "Friska" we just saw the exit as some thing different but with the same result, that's trading Both looking at the same thing, for example, I would opt for the one on the left but I think Friska would go for the one on the right although both do exactly the same thing. {image} {image}
{quote} I welcome criticism! And you have a point I should post complete charts. I'm in a trade right now...when I'll close it I'll post it on a chart with proper line studies. Here it goes, trade is closed and overall I added +13 to my performance. Took three more scalps. The chart looks pretty messy, hope you guys can understand. It's basic SRs and psychological levels. Keep in mind that I do not trade SR levels, but price. I only expect price to have certain behaviors at these SR levels. {image}.
Now look at the EU go...same stuff as yesterday I miss the healthy moves and take the scalps. And I was expecting this, I was expecting price to move after the job reports since there was a good buildup. There was a fractal 1-2-3 in the middle of the range and seeing that it came right after a strong candle up I could have easily taken a long. They should make a facepalm emoji.....
Oh well...I'm done for today. Have a good one lads. I'll keep watching the EU and count the pips I didn't take :-))
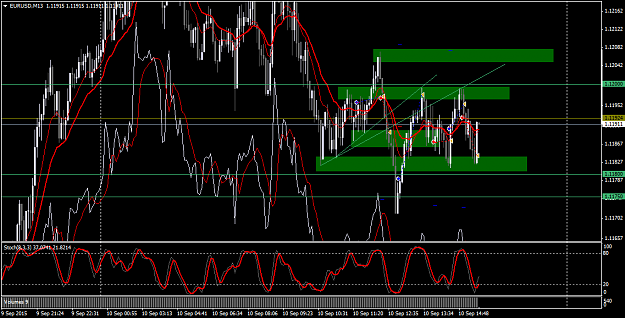
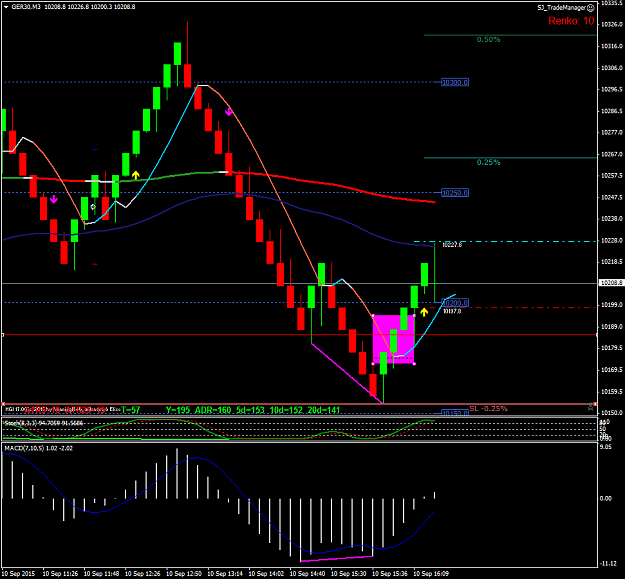
Newbie to this thread, so be gentle please I feel I should have caught this reversal simply by seeing the div and close over the MA - is my logic correct here? {image}
Ignored
Just my 2 cents. Divergences and closes over / under the MA can happen anytime in any chart. You need to have more behind a trade. Understanding of price action and of support and resistance. Don't trade only divergences and closes over / under MAs. Look back and I'm sure you will find divergences that failed.
Price doesn't move because there is a divergence. Price moves because there is an imbalance in the supply / demand report. The divergences show loss of momentum which may indicate the beginning of this sort of imbalance.
Dee mentioned something like this, I don't remember the exact words....an indicator can show divergences in a trend for extended periods. So, trading only divergences will drain your account.