• Home
  • Forums
  • Trades
  • News
  • Calendar
  • Market
  • Brokers
  • Login
  • Join
  • User/Email: Password:
  • 4:46am
Menu
  • Forums
  • Trades
  • News
  • Calendar
  • Market
  • Brokers
  • Login
  • Join
  • 4:46am
Sister Sites
  • Metals Mine
  • Energy EXCH
  • Crypto Craft

Options

Bookmark Thread

First Page First Unread Last Page Last Post

Printable Version

Similar Threads

Spaghetti Indicator (28 Pair Relative Strength ) 163 replies

Pair analyzer script 2 replies

Price info indicator needed - one pair's price x another pair 5 replies

Equity Analyzer Indicator? 4 replies

Technical Analyzer 0 replies

  • Platform Tech
  • /
  • Reply to Thread
  • Subscribe
  • 161
Attachments: Pair Strength Analyzer indicator
Exit Attachments

Pair Strength Analyzer indicator

  • Last Post
  •  
  • 1 34Page 567 21
  • 1 4Page 56 21
  •  
  • Post #81
  • Quote
  • Apr 24, 2015 10:00am Apr 24, 2015 10:00am
  •  symona
  • | Joined Nov 2013 | Status: Member | 229 Posts
Quoting FerruFx
Disliked
{quote} I personnaly don't have it ... and anyway David removed it for a reason ... so don't expect it to be reposted here. We must respect the author decision ...
Ignored
Ferru, thanks for your reply. I don't expect it to be posted, that's why I suggested another way like personal message or email. Too bad one person ruined it for the rest of us...
  • Post #82
  • Quote
  • Apr 24, 2015 10:19am Apr 24, 2015 10:19am
  •  FerruFx
  • Joined May 2007 | Status: MT4/MT5 EAs/Indicators/Alerts coder | 6,783 Posts
Quoting symona
Disliked
{quote} Too bad one person ruined it for the rest of us...
Ignored
I agree with you.
MT4/MT5 EAs/Indicators/Alerts coder
  • Post #83
  • Quote
  • May 30, 2015 6:34am May 30, 2015 6:34am
  •  belief
  • | Joined Jun 2006 | Status: Member | 409 Posts
Hi David, is it possible to include stochastic levels respectively to the pairs in this indicator?
  • Post #84
  • Quote
  • Edited at 8:49am May 30, 2015 8:33am | Edited at 8:49am
  •  hanover
  • Joined Sep 2006 | Status: ... | 8,081 Posts
Quoting belief
Disliked
Hi David, is it possible to include stochastic levels respectively to the pairs in this indicator?
Ignored
Sorry, but I have no plans to enhance the indicator further at this point.

The indy is designed to show trend strength/weakness rather than overbought/oversold (and I believe that there are better ways than stochastics to discern the latter, e.g. depth of retracement; Tom Demark sequential bar count; pivot levels; pips moved thus far vs ADR; etc).

Anyway, if you like stochastics you might like to try the attached indicator instead. Screenshot here.
Attached File
File Type: ex4 Stochastic Dashboard.ex4   33 KB | 740 downloads
  • Post #85
  • Quote
  • May 30, 2015 9:24am May 30, 2015 9:24am
  •  tankokjian
  • | Joined May 2010 | Status: Member | 2,437 Posts
Thank you author for sharing this
  • Post #86
  • Quote
  • May 30, 2015 1:20pm May 30, 2015 1:20pm
  •  amirchegher
  • | Joined Jan 2015 | Status: Member | 12 Posts
Quoting hanover
Disliked
{quote} Sorry, but I have no plans to enhance the indicator further at this point.
Ignored

Can I help ???
  • Post #87
  • Quote
  • May 30, 2015 8:23pm May 30, 2015 8:23pm
  •  belief
  • | Joined Jun 2006 | Status: Member | 409 Posts
Hi David, is it possible to include stochastic levels (colored red if above 80, colored green below 20) respectively to the pairs in this indicator?
  • Post #88
  • Quote
  • Edited May 31, 2015 8:52am May 30, 2015 9:07pm | Edited May 31, 2015 8:52am
  •  hanover
  • Joined Sep 2006 | Status: ... | 8,081 Posts
Quoting belief
Disliked
Hi David, is it possible to include stochastic levels (colored red if above 80, colored green below 20) respectively to the pairs in this indicator?
Ignored
You can set up to 9 colors and levels using the Colors setting. The default setting does exactly what you're asking for (assuming I understand you correctly). See the link to the screenshot in my earlier post.
____________________

[EDIT] I found a later version of the indicator in my archives. I've attached both files.

This version compiles with no errors on MT4 build 509, and the ex4 appears to run 100% on both Pepperstone build 745 and AxiTrader build 610.

I recommend installing the .ex4 file only. If you attempt to compile the .mq4 on build 600 or later, you'll likely get errors (more info in this thread). I've included the .mq4 source file only in case another programmer wants to update it, in which case the code libraries that the indy uses can be found in this thread (many thanks to pips4life for upgrading them).
Attached Files
File Type: ex4 Stochastic Dashboard.ex4   35 KB | 684 downloads
File Type: mq4 Stochastic Dashboard.mq4   6 KB | 833 downloads
  • Post #89
  • Quote
  • Edited at 11:39am Jun 1, 2015 10:10am | Edited at 11:39am
  •  PNWtrader
  • | Joined Nov 2014 | Status: Member | 2 Posts
Quoting hanover
Disliked
{quote}
Ignored
Hey Hanover,

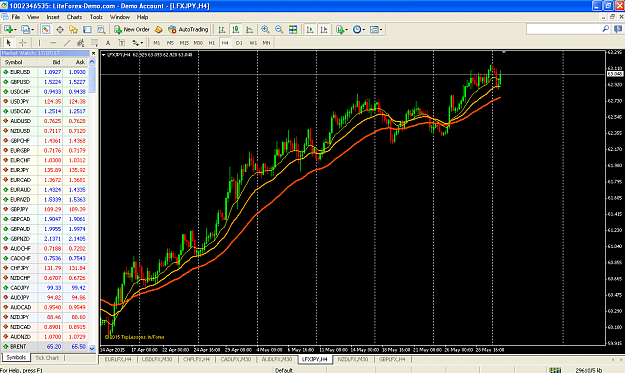
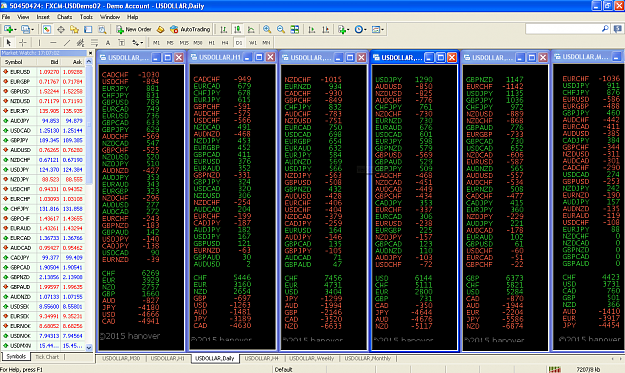
Awesome indicator, thanks for the upload. Having an issue though with the Yen. The Yen Currency Index is extremely bullish on all time frames, while the Strength Analyzer shows it being extremely bearish on all time frames. Every other currency's index and strength analyzer match up perfectly, but JPY seems to be opposite. Any thoughts?

*In the pics, I have multiple strength analyzers for multiple time frames, left to right: 30m 1h 4h 1D 1W 1M
You can see they are all showing the Yen tanking, while on the Yen index chart (4H) it is skyrocketing.

Cheers
Attached Images (click to enlarge)
Click to Enlarge

Name: Screen Shot 2015-06-01 at 7.10.34 AM.png
Size: 96 KB Click to Enlarge

Name: Screen Shot 2015-06-01 at 7.10.17 AM.png
Size: 146 KB
  • Post #90
  • Quote
  • Edited at 5:21pm Jun 1, 2015 12:13pm | Edited at 5:21pm
  •  hanover
  • Joined Sep 2006 | Status: ... | 8,081 Posts
Quoting PNWtrader
Disliked
{quote} Hey Hanover, Awesome indicator, thanks for the upload. Having an issue though with the Yen. The Yen Currency Index is extremely bullish on all time frames, while the Strength Analyzer shows it being extremely bearish on all time frames. Every other currency's index and strength analyzer match up perfectly, but JPY seems to be opposite. Any thoughts? *In the pics, I have multiple strength analyzers for multiple time frames, left to right: 30m 1h 4h 1D 1W 1M You can see they are all showing the Yen tanking, while on the Yen index chart (4H)...
Ignored
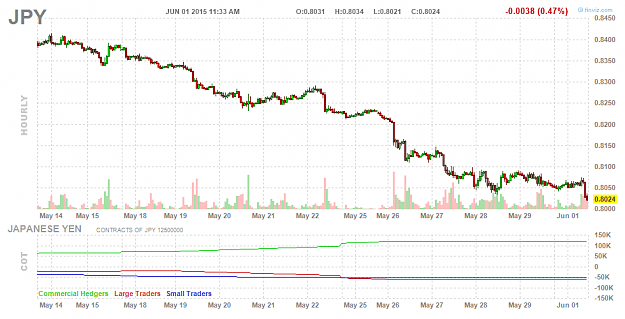
I would argue that Yen is weak/bearish at the moment. My first attached screenshot comes from the yen futures index (6J), an independent source.

Final values of PSA (e.g. -4454 for JPY in your last screenshot) are obtained by plotting regression lines on the charts of the pairs that you nominate (USDJPY, EURJPY etc), and then summing their slope values (positively for the first named currency in the pair, and negatively for the second named currency in the pair). Look at a H4 chart of USDJPY (my second screenshot). It is rising strongly. That means that JPY is weak(ening) relative to USD. Now look at charts for other XXXJPY pairs/timeframes that you specified in PSA's CurrencyPairs and PeriodsForRegr parameters, and plot regression lines of lengths that you used in PSA's LengthsforRegr parameter. To whatever extent the majority of the lines slope upward, it means that JPY is weak/bearish relative to the first named currency. PSA correctly measures whatever you ask it to measure.

I Googled "how is LFXJPY calculated?" and found this, where post #4098 by 'hussin naiji' states that

USD LFX * LFX JPY =USDYEN

Assuming this is correct, then if USDLFX is constant, and LFXJPY is rising (as in your screenshot), then mathematically USDJPY would likewise be rising, and therefore yen is weakening. Hence I would suggest that your LFXJPY chart further validates PSA.
Attached Images (click to enlarge)
Click to Enlarge

Name: PPI 192.png
Size: 27 KB Click to Enlarge

Name: PPI 193.png
Size: 31 KB
  • Post #91
  • Quote
  • Jun 2, 2015 11:17am Jun 2, 2015 11:17am
  •  PNWtrader
  • | Joined Nov 2014 | Status: Member | 2 Posts
Quoting hanover
Disliked
{quote} I would argue that Yen is weak/bearish at the moment....
Ignored
Thanks for the reply. So even if Yen is flat, or even going up slightly, it can still show up on the PSA as being weak if other currencies are outperforming it. Makes sense.

I've also been assuming that the Index (LFXJPY) was derived from a basket of currencies, similar to the PSA. I wasn't aware it was independently calculated, and then used to calculate the exchange rate.

Cheers
  • Post #92
  • Quote
  • Jun 2, 2015 5:14pm Jun 2, 2015 5:14pm
  •  hanover
  • Joined Sep 2006 | Status: ... | 8,081 Posts
Quoting PNWtrader
Disliked
So even if Yen is flat, or even going up slightly, it can still show up on the PSA as being weak if other currencies are outperforming it.
Ignored
Writing strength indicators taught me that everything in forex is relative. So when you say "if yen is flat, or going up slightly", it is not that JPY is those things in or of itself; but rather that it's flat, or going up, relative (and on average) to the other currencies it's being measured against. That is what PSA is reporting.

Like all indicators, PSA derives its values from past candle data. Hence currency strength/weakness has no more predictive value than the candles of the component pairs that are contributing to its value.
  • Post #93
  • Quote
  • Jul 1, 2015 9:08am Jul 1, 2015 9:08am
  •  fuzz
  • | Joined Feb 2014 | Status: Member | 159 Posts
Am I doing anything wrong because I load up the indicator with default settings but nothing shows up?

EDIT: Nevermind, was symbol suffix problem
Attached Image
  • Post #94
  • Quote
  • Jul 2, 2015 1:25am Jul 2, 2015 1:25am
  •  forexdave1
  • | Joined Jul 2014 | Status: Member | 75 Posts
Hanover, would you have some recommendations for helpful indicators to show ob/os levels? Have you coded anything?
thanks so much!


Quoting hanover
Disliked
{quote} Sorry, but I have no plans to enhance the indicator further at this point. The indy is designed to show trend strength/weakness rather than overbought/oversold (and I believe that there are better ways than stochastics to discern the latter, e.g. depth of retracement; Tom Demark sequential bar count; pivot levels; pips moved thus far vs ADR; etc). Anyway, if you like stochastics you might like to try the attached indicator...
Ignored
  • Post #95
  • Quote
  • Edited Jul 3, 2015 4:17am Jul 2, 2015 1:25pm | Edited Jul 3, 2015 4:17am
  •  hanover
  • Joined Sep 2006 | Status: ... | 8,081 Posts
Quoting fuzz
Disliked
Am I doing anything wrong because I load up the indicator with default settings but nothing shows up? EDIT: Nevermind, was symbol suffix problem {image}
Ignored
Glad to hear that you solved it.
__________________________

Quoting forexdave1
Disliked
Hanover, would you have some recommendations for helpful indicators to show ob/os levels? Have you coded anything? thanks so much! {quote}
Ignored
Dave,

Recommendations: all of the following work some of the time.

Depth of retracement:
 Native MT4 fibo tool
 Native MT4 deviation channel (useful despite repainting)
 Simply use the top and bottom of the visible chart (seriously!)

Bollinger bands can be a helpful 3-in-1 tool for highlighting:
 OB/OS (95% of Gaussian distribution lies within 2 SDs of the mean)
 Volatility (expansion/consolidation)
 State of market (breakout/trending/ranging)

Tom Demark sequential bar count: see attached MAB_TD_Sequential indicator. Google something like "Tom Demark sequential count" for more info (e.g. here).

Pivot levels: there are hundreds of indicators around for plotting these, e.g. this thread, also here here and here.
I use Critical Levels (latest version attached below; more info here), it can also optionally plot prior D/W/M candle high/lows, round numbers, fibo levels, MA levels

Pips moved thus far vs ADR: again, there are many indicators available, I use Signal and Display Info. Latest versions attached below.

S/R (supply/demand zones): I use the indicators attached here.

NOTE: re the indicators in the links, I recommend installing the .ex4 file only. If you attempt to compile the .mq4 on build 600 or later, you'll likely get errors (more info in this thread). If you want error-free compiles, use MT4 build 509 (see this thread).

Have I coded anything? Of the above: Signal, Display Info, Critical Levels.

David
Attached Files
File Type: ex4 MAB_TD_Sequential.ex4   14 KB | 931 downloads
File Type: ex4 Critical Levels.ex4   40 KB | 1,062 download
File Type: ex4 Display Info All Pairs.ex4   43 KB | 1,136 download
File Type: ex4 Signal.ex4   30 KB | 870 downloads
  • Post #96
  • Quote
  • Jul 2, 2015 11:07pm Jul 2, 2015 11:07pm
  •  forexdave1
  • | Joined Jul 2014 | Status: Member | 75 Posts
Thx for the homework!!

Quoting hanover
Disliked
{quote} Glad to hear that you solved it. __________________________ {quote} Dave, Recommendations: all of the following work some of the time. Depth of retracement:  Native MT4 fibo tool  Native MT4 deviation channel (useful despite repainting)  Simply use the top and bottom of the visible chart (seriously!) Bollinger bands can be a helpful 3-in-1 tool for highlighting:  OB/OS (95% of Gaussian distribution lies within 2 SDs of the mean)  Volatility (expansion/consolidation)  State of...
Ignored
  • Post #97
  • Quote
  • Jul 2, 2015 11:55pm Jul 2, 2015 11:55pm
  •  blueface
  • Joined Sep 2014 | Status: Member | 234 Posts
Quoting hanover
Disliked
{quote} Glad to hear that you solved it. __________________________ {quote} Dave, Recommendations: all of the following work some of the time. Depth of retracement:  Native MT4 fibo tool  Native MT4 deviation channel (useful despite repainting)  Simply use the top and bottom of the visible chart (seriously!) Bollinger bands can be a helpful 3-in-1 tool for highlighting:  OB/OS (95% of Gaussian distribution lies within 2 SDs of the mean)  Volatility (expansion/consolidation)  State of...
Ignored
Hi hanover

if you can share your Bollinger bands indi?


thx a lot.
  • Post #98
  • Quote
  • Edited at 7:53am Jul 3, 2015 1:27am | Edited at 7:53am
  •  hanover
  • Joined Sep 2006 | Status: ... | 8,081 Posts
Quoting blueface
Disliked
{quote} Hi hanover if you can share your Bollinger bands indi? thx a lot.
Ignored
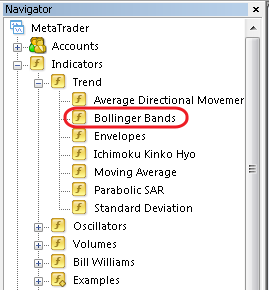
I have no special indicator. BBs are native to MT4 (see second screenshot).
________________________

Bollinger Band basics (for anybody that's interested):

Standard settings for BBs are a 20 period SMA median line, with upper/lower bands set 2 standard deviations above/below this median.

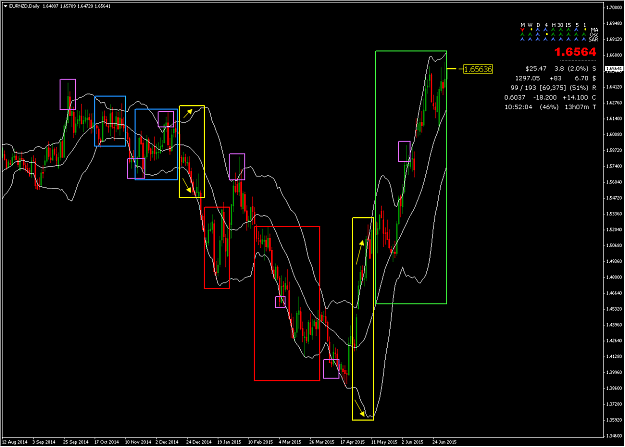
First screenshot illustrates how BBs can be used to 'characterize' the market:

 In a rangebound (aka sideways or consolidating) market, price moves between the (usually narrow) bands — see the first blue box. [Possible trading strategy: buy when price reaches the lower band; sell at the upper band]
In the second blue box, price remains rangebound, but oscillates across a wider range.

 Volatility can be measured by the width between the upper and lower bands. During breakouts (yellow boxes), the bands usually widen suddenly and sharply. [Possible trading strategy: buy upside breakouts; sell downside breakouts]
When price starts to consolidate again, the band width narrows.

 Trend: BB median line is a SMA(20) whose slope gives a lagging indication of trend direction. During an uptrend (green box), price tends to stay within the upper half of the bands. During a downtrend (red box), price tends to stay within the lower half of the bands. [Possible trading strategy: buy on pullbacks to the median line in an uptrend; sell on pullbacks to the median line in a downtrend]
In the screenshot example, the upside breakout happens to lead to an uptrend (second yellow box is followed by a green box); and downside breakout is followed by downtrend (first yellow box is followed by a red box). An example of where this doesn't occur: between the two blue boxes, there is a small downside breakout (yellow box not shown), but price reverts to a range rather than a full-blown downtrend.

 OB/OS: Price may be termed 'overbought' or 'oversold' when it is above or below the BBs, respectively (purple boxes). Statistically, less than 5% of the price action takes place outside of the BBs. [Possible trading strategy: buy when OS; sell when OB]

Given all of the above, BBs are a nice 'one stop shop' indy IMHO. However, like all analysis, BBs are lagging, and whether any of this in itself has a predictive value, is questionable; especially as price can be in one state (ranging/trending/breakout etc) on one timeframe, and in a different state on another. The trading strategies are merely logical extensions of the concepts, and 'work' some of the time (when the current state happens to continue, rather than change). For better results, combine longer timeframe BBs with strength/weakness/flows/fundamental analysis (summary: see this post, and this thread), reversal candles (e.g. outside bars; candles that close above/below previous high/low), S/D zones — and be prepared to ride fundamentally backed trends, and exit any losses quickly.
Attached Image (click to enlarge)
Click to Enlarge

Name: PPI 246.png
Size: 41 KB
Attached Image
  • Post #99
  • Quote
  • Jul 3, 2015 2:46am Jul 3, 2015 2:46am
  •  blueface
  • Joined Sep 2014 | Status: Member | 234 Posts
Hi

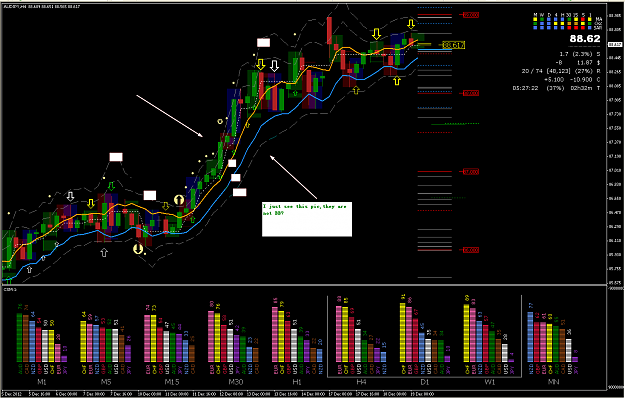
I see your post here,I dont what is the indi,I guess is BB?


http://www.forexfactory.com/showthread.php?t=245064

Attached Image (click to enlarge)
Click to Enlarge

Name: 2012-12-19_1630_001.png
Size: 53 KB


thx a lot.
  • Post #100
  • Quote
  • Jul 3, 2015 3:01am Jul 3, 2015 3:01am
  •  hanover
  • Joined Sep 2006 | Status: ... | 8,081 Posts
Quoting blueface
Disliked
Hi I see your post here,I dont what is the indi,I guess is BB? http://www.forexfactory.com/showthread.php?t=245064 {image} thx a lot.
Ignored
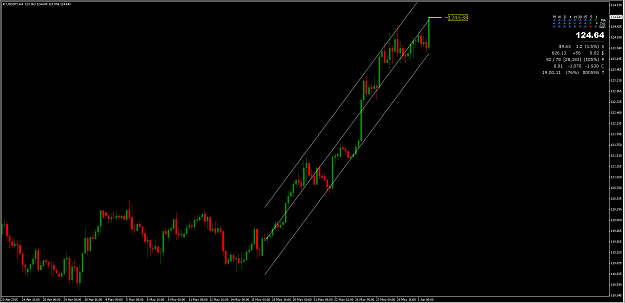
No, the channels in your screenshot are calculated and plotted by a proprietary trend-following system ('Athena').
  • Platform Tech
  • /
  • Pair Strength Analyzer indicator
  • Reply to Thread
    • 1 34Page 567 21
    • 1 4Page 56 21
0 traders viewing now
  • More
Top of Page
  • Facebook
  • Twitter
About FF
  • Mission
  • Products
  • User Guide
  • Media Kit
  • Blog
  • Contact
FF Products
  • Forums
  • Trades
  • Calendar
  • News
  • Market
  • Brokers
  • Trade Explorer
FF Website
  • Homepage
  • Search
  • Members
  • Report a Bug
Follow FF
  • Facebook
  • Twitter

FF Sister Sites:

  • Metals Mine
  • Energy EXCH
  • Crypto Craft

Forex Factory® is a brand of Fair Economy, Inc.

Terms of Service / ©2021