• Home
  • Forums
  • Trades
  • News
  • Calendar
  • Market
  • Brokers
  • Login
  • Join
  • 6:50pm
Menu
  • Forums
  • Trades
  • News
  • Calendar
  • Market
  • Brokers
  • Login
  • Join
  • 6:50pm
Sister Sites
  • Metals Mine
  • Energy EXCH
  • Crypto Craft

Options

Bookmark Thread

First Page First Unread Last Page Last Post

Print Thread

Similar Threads

MT4 Breakout Alert Bollinger Band & Donchian Channel indi? 0 replies

rsi & bollinger band alert indicator 0 replies

Stochastic divergence indicator with stochastic cross? 0 replies

Bollinger Band trade tools - Trade Manager & Dashboard 31 replies

ema bollinger band alerts 1 reply

  • Trading Systems
  • /
  • Reply to Thread
  • Subscribe
  • 3
Attachments: Bollinger Band & Stochastic
Exit Attachments
Tags: Bollinger Band & Stochastic
Cancel

Bollinger Band & Stochastic

  • Last Post
  •  
  • Page 1 2
  • Page 1 2
  •  
  • Post #1
  • Quote
  • First Post: Edited Sep 28, 2014 7:18am Sep 27, 2014 8:55pm | Edited Sep 28, 2014 7:18am
  •  StingrayEA
  • | Joined Sep 2014 | Status: Member | 80 Posts
Dear,
First of all, this stategy is quite simple, and but is not a holy grill.
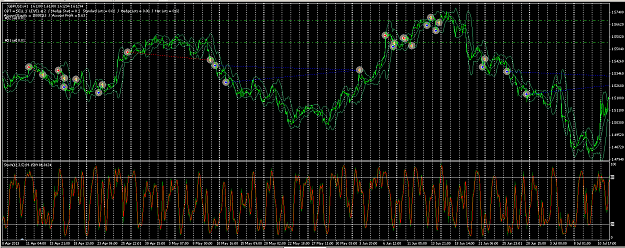
The strategy setup is using the default of Bollinger band (period 20, deviation 2, shift 0 ) and Stochastic ( 14,3,3 ).
Quite long time when i first learn the forex , I hate Stochastic very much, because of my misunderstanding with this indicator.
Later i found it after i am self-experiment ( of course with some my saving money .... ) , this indicator can help me :

  1. Filtering my emotion (When i must open or take position )
  2. Filtering my greedy ( Want to have a big cash in short period )
  3. Knowing when i can prepare for my next Position ( of course with Bollinger band help and Candlestick reversal pattern )

Ok, This is my simple strategy ( and i am in the progress for my EA with this base of strategy ).

*------- cross with Upper Band ( do the same for lowerband )
Buy Entry
1. The previous candle ( from current candle ) cross BB Upper from below
2. Main Stochastic above Signal Stochastic
3. The Current Candle is bullish and Stochastic below 80

Sell Entry
1. The previous candle ( from current candle ) cross BB upper from above.
2. Main Stochastic below Signal Stochastic
3. The current Candle is bearish and Stochastic above 20

Take profit : 50
Trailing Stop 15
Stop Loss : 50
Time Frame H1
Any Currency.

The candlestick that i often use it Bullish and bearish engulfing.
Please beware that Forex is a business with high risk, This Strategy is work on me, so it's under your own risk.

Trade Well.

Attached Image

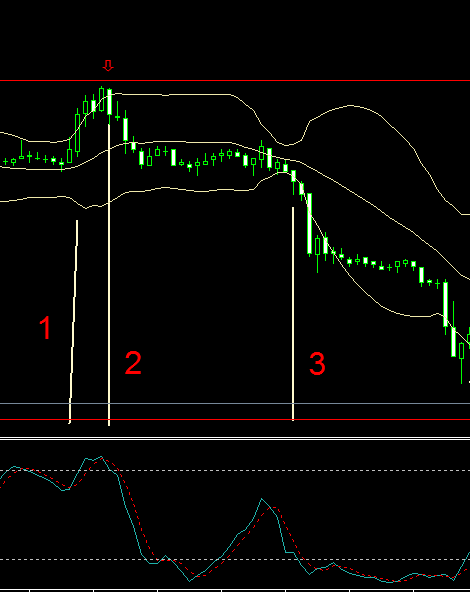
no.1 no entry. ( the stochastic is already Overbought area)
no.2 sell entry
no.3 sell entry
  • Post #2
  • Quote
  • Sep 28, 2014 7:23am Sep 28, 2014 7:23am
  •  Anusragger
  • | Joined Nov 2012 | Status: No Impact Member (bottom 1%) | 740 Posts
John Bollinger said: "tags
of the bands are just that - tags, not signals. A
tag of the upper bollinger band is not in and
of itself a sell signal. A tag of the lower
band is not in and of itself a buy signal". Price
often can and does "walk the band".
 
 
  • Post #3
  • Quote
  • Sep 28, 2014 7:48am Sep 28, 2014 7:48am
  •  StingrayEA
  • | Joined Sep 2014 | Status: Member | 80 Posts
Quoting Anusragger
Disliked
John Bollinger said: "tags of the bands are just that - tags, not signals. A tag of the upper bollinger band is not in and of itself a sell signal. A tag of the lower band is not in and of itself a buy signal". Price often can and does "walk the band".
Ignored
Yup. most of Indicator, even all indicator creator said like that, same as a car inventor, they said, that "A car although small is a machine that can hazard to other people or environtment, so be wise of it " So John Bollinger make it this indicator , to make it easier for the user to see and check which way the price move along.
Thanks and credit goes to John Bollinger. Some of the trader also alter the deviation to adjust with their reaction view. So on my strategy I am using upper band and lower band as support and resistant, so if the price cross the upper band from below, for me is the price breakout the resistant, but I need confirmation , one if from Stochastic and the other is from candlestick.
So we must flexible about "how we took and care about indicator that we are use" because they create with certain calculation and formula, I believe they have the reason behind of their formula. I believe "Motorcycle can overpass the Ferrari when they race on the public road"
upper Bollinger and lower Bollinger band can use as support and resistant, they work like envelope indicator ( but slightly different ) , the other use of the band is also to check the market is sideways or trend. but who make it squeeze or unsqueeze ? The market.
This strategy you can combined with money management and compound .... Money
 
 
  • Post #4
  • Quote
  • Sep 28, 2014 9:58am Sep 28, 2014 9:58am
  •  StingrayEA
  • | Joined Sep 2014 | Status: Member | 80 Posts
The chart almost naked, so clean, just when the price close to one of the band, be patient and wait, the price continue or reversal.
It's very easy but need confirmation from other indicator.
Hope profit soon.
 
 
  • Post #5
  • Quote
  • Sep 28, 2014 10:18am Sep 28, 2014 10:18am
  •  billbss
  • Joined Apr 2006 | Status: Member | 4,301 Posts
I don't see many winners with this.
How do you define an engulfing bar? There are many definitions. What is yours?
 
 
  • Post #6
  • Quote
  • Sep 28, 2014 11:06am Sep 28, 2014 11:06am
  •  dkrock
  • Joined Jul 2013 | Status: Gone | 1,106 Posts
The center line of your bollinger band is a 20 period simple moving average.

The stochastics 14/3/3 approximately follows the 14 simple moving average. If you draw a 50 level line on your stochastics, it will closely mirror when price crosses the 14 period simple moving average on your chart.

This system therefore trades when price is perceived to be exhausted within the 20 and 14 simple moving averages on the 1HR chart. First, I hope you have a lot of free time to monitor 1HR trades, and second, I hope you will only see range movement. Should the price trend, neither of your indicators will help you.

I wish to point out a flaw in your analysis too. This is a common mistake because you can see what is happening next, so your brain makes decisions based on unsupported hypothesis. In your sample picture, you did not take trade 1 because you said the stochastics was already overbought. Okay, great. Then why did trade 3 get taken? The stochastics is already oversold. When you are trading live, you cannot see the next 20 candles Therefore, in reality, you cannot take trade 3 either, according to your rule. That is unless you are only going to trade historical charts?

The better level for trading stochastics is the 50 line. If it were me, I would delete the 20 and 80. However, your system is really only trading when price is above/below the 14 and 20 SMA.

Because stochastics cannot properly show the range of price, it is not the ideal indicator for the type of strategy you are attempting to use. It tends to lay flat at the upper/lower limit of price volatility. Its only valid signal is crossing the 50 line, but you can also see the same signal with a 14 period SMA, so it is up to you which one to use.

Besides being unable to trade trends, you also are prone to head fakes when the market is in consolidation. And since you have chosen the 1HR chart, you are going to have considerable losses each time you are head faked.

It is a good idea, but not practical with the tools you are using. Whether you know it or not, you are really attempting to measure momentum and for me, I have found that method to be the most profitable technique to use. However, you can use better tools to help you determine entries and exits. Keep your overall strategy, but improve your ability to measure the range of price movement. I am going to assume that because this is a 1HR strategy that you have not actually tried to trade this method on the live market for very long. Historical charts are exciting, but the live market is the only chart that matters. Good Luck.
You cannot be extraordinary by being normal
 
1
  • Post #7
  • Quote
  • Sep 28, 2014 12:40pm Sep 28, 2014 12:40pm
  •  StingrayEA
  • | Joined Sep 2014 | Status: Member | 80 Posts
Wow, Thanks and appreciate for your idea.
 
 
  • Post #8
  • Quote
  • Sep 28, 2014 12:44pm Sep 28, 2014 12:44pm
  •  StingrayEA
  • | Joined Sep 2014 | Status: Member | 80 Posts
Quoting billbss
Disliked
I don't see many winners with this. How do you define an engulfing bar? There are many definitions. What is yours?
Ignored
Hi, I am using only 2 reversal bar, first , if the bearish candle cross upper band or lower band from below then the next candle is open above the band, my next step is check for Stochastic condition. But when the reversal pattern such bullish or bearish engulfing is create near the band I will wait for stochastic line reverse the direction.
By the way thanks and appreciate for your attention and question.
Happy Trade.
 
 
  • Post #9
  • Quote
  • Sep 28, 2014 1:37pm Sep 28, 2014 1:37pm
  •  Magix
  • Joined Feb 2009 | Status: Half in the Bag | 17,826 Posts
Quoting billbss
Disliked
I don't see many winners with this. How do you define an engulfing bar? There are many definitions. What is yours?
Ignored
I think it'd go a little like this...

Inserted Code
extern int       OS=20;
extern int       OB=80;
  
      double upBBf2=iBands(Symbol(),0,bb_periodf,bb_deviationf,0,PRICE_CLOSE,MODE_UPPER,2);
      double loBBf2=iBands(Symbol(),0,bb_periodf,bb_deviationf,0,PRICE_CLOSE,MODE_LOWER,2);
        
          double smpM=iStochastic(NULL,0,k,d,slowing1,MODE_SMA,0,MODE_MAIN,2);
          
         if (Close[2]>Open[2]&&Close[2]>upBBf1&&smpM>OB&&Close[1]<Open[2])return (sell);
         if (Close[2]<Open[2]&&Close[2]<loBBf2&&smpM<OS&&Close[1]>Open[2])return (buy);

Money Can't Buy Happiness. Poverty Can't Buy SHIT! You Choose!
 
 
  • Post #10
  • Quote
  • Sep 28, 2014 3:06pm Sep 28, 2014 3:06pm
  •  turnip15
  • Joined Sep 2006 | Status: Member | 9,751 Posts
RYANMCD traded a similar system but his entries followed logic as opposed to hindsight

http://www.forexfactory.com/ryanmcd

Jankone also traded with a similar approach, his inspiration being RYANMCD:

www.forexfactory.com/jankone

Both the above are worth a look imho.
every Saint has a past. Every Sinner has a Future
 
 
  • Post #11
  • Quote
  • Sep 28, 2014 3:39pm Sep 28, 2014 3:39pm
  •  StingrayEA
  • | Joined Sep 2014 | Status: Member | 80 Posts
Quoting turnip15
Disliked
RYANMCD traded a similar system but his entries followed logic as opposed to hindsight http://www.forexfactory.com/ryanmcd Jankone also traded with a similar approach, his inspiration being RYANMCD: www.forexfactory.com/jankone Both the above are worth a look imho.
Ignored
Hi,
Nice to meet you.
Thanks your attention and idea.
 
 
  • Post #12
  • Quote
  • Sep 28, 2014 3:41pm Sep 28, 2014 3:41pm
  •  StingrayEA
  • | Joined Sep 2014 | Status: Member | 80 Posts
Quoting Magix
Disliked
{quote} I think it'd go a little like this... extern int OS=20; extern int OB=80; double upBBf2=iBands(Symbol(),0,bb_periodf,bb_deviationf,0,PRICE_CLOSE,MODE_UPPER,2); double loBBf2=iBands(Symbol(),0,bb_periodf,bb_deviationf,0,PRICE_CLOSE,MODE_LOWER,2); double smpM=iStochastic(NULL,0,k,d,slowing1,MODE_SMA,0,MODE_MAIN,2); if (Close[2]>Open[2]&&Close[2]>upBBf1&&smpM>OB&&Close[1]<Open[2])return (sell); if (Close[2]<Open[2]&&Close[2]<loBBf2&&smpM<OS&&Close[1]>Open[2])return (buy);
Ignored
Thanks for your script. the candle number is candle[1] and candle[0] , candle[0] for confirmation and correlation with Stochastic condition. Candle[1] .. Open and Close for cross detecting the band.
Thanks Magix.
 
 
  • Post #13
  • Quote
  • Sep 28, 2014 3:55pm Sep 28, 2014 3:55pm
  •  StingrayEA
  • | Joined Sep 2014 | Status: Member | 80 Posts
Attached Image

more picture
 
 
  • Post #14
  • Quote
  • Sep 28, 2014 4:05pm Sep 28, 2014 4:05pm
  •  Magix
  • Joined Feb 2009 | Status: Half in the Bag | 17,826 Posts
Quoting StingrayEA
Disliked
{quote} Thanks for your script. the candle number is candle[1] and candle[0] , candle[0] for confirmation and correlation with Stochastic condition. Candle[1] .. Open and Close for cross detecting the band. Thanks Magix.
Ignored

Grand Scheme of things and with a cost average in at the same size lot with confirmation signals and not working with a trailing stop...

Doesn't look to be the worst system I have come across...

There are some hits or waits that you would have to take, but if you are only looking for a trade or 2 per week...Not bad.

Keep up the good work Sting!

Attached Image (click to enlarge)
Click to Enlarge

Name: Cost Averaged.png
Size: 112 KB
Money Can't Buy Happiness. Poverty Can't Buy SHIT! You Choose!
 
 
  • Post #15
  • Quote
  • Sep 28, 2014 5:50pm Sep 28, 2014 5:50pm
  •  StingrayEA
  • | Joined Sep 2014 | Status: Member | 80 Posts
Quoting Magix
Disliked
{quote} Grand Scheme of things and with a cost average in at the same size lot with confirmation signals and not working with a trailing stop... Doesn't look to be the worst system I have come across... There are some hits or waits that you would have to take, but if you are only looking for a trade or 2 per week...Not bad. Keep up the good work Sting! {image}
Ignored
Thanks Magix
 
 
  • Post #16
  • Quote
  • Mar 16, 2017 12:00am Mar 16, 2017 12:00am
  •  thangnd.1211
  • | Joined Dec 2016 | Status: Member | 244 Posts
anyone have a EA based on this strategy, please share for me, thank you
 
 
  • Post #17
  • Quote
  • Sep 26, 2019 2:32am Sep 26, 2019 2:32am
  •  khanpk
  • | Joined Jan 2019 | Status: Member | 19 Posts
kindly share its download thanks
 
 
  • Post #18
  • Quote
  • Sep 26, 2019 2:45am Sep 26, 2019 2:45am
  •  zenaldinz
  • | Joined Sep 2019 | Status: Member | 5 Posts
This is very good strategh. Keep it up. Hopefully someone will share the ea.
 
 
  • Post #19
  • Quote
  • Sep 26, 2019 5:15am Sep 26, 2019 5:15am
  •  tiger2019
  • | Joined Sep 2019 | Status: Junior Member | 1 Post
Yes, I´m triying and seems that work well , if someone could make and EA we could do a backtest to check. Thanks stingray!
 
 
  • Post #20
  • Quote
  • May 23, 2021 7:51am May 23, 2021 7:51am
  •  TampaDave
  • | Joined Mar 2021 | Status: Member | 33 Posts
Hi all

I have been “testing” the BB/Stochastic for 2 weeks on a live account with a .01 lot. My goal for this strategy is to scalp 10 pips at a time. I have executed trades on all the major pairs as well as Bitcoin on either the 15m or 30m time frames.

BB -20/2
Stochastic-14,3,3

Long:
Price is at or below lower BB
Stochastic is below 20
Buy is executed when the Main Stochastic makes a clear and decisive cross up and over the Signal line.

A short position is taken when the opposite conditions are met.(Stochastic above 80)

As with any trading strategy, patience is required. Do not anticipate the cross. Do not enter when the Stochastic lines merely touch. Wait for a “good crossover”.

The results have been beyond anything else I have seen. 10 pips is such a small movement of the candles and is achieved time and time again. The drawback has consistently been less than 10 pips, usually less than 5 or 6.

It is understood that with this strategy you will potentially miss out on the big moves. I say potentially because you can of course use market structure and/trailing stops to ride the trades out. But for me, having a very demanding day job, studying the charts throughout the day is not possible. Attempting that in the past has been quite detrimental.

I know some will scoff at this idea and that is fine. But give it a try on a demo account before it is dismissed completely.

For the new traders, 10 pips may sound like nothing. But realize 10 pips on a 1.0 lot is $100 and these set ups occur several times per day. Also worth noting is that the indicators are standard on mt4, so it works on mobile devices. The chart is very clean and scanning the market is quick and simple.
 
1
  • Trading Systems
  • /
  • Bollinger Band & Stochastic
  • Reply to Thread
    • Page 1 2
    • Page 1 2
0 traders viewing now
  • More
Top of Page
  • Facebook
  • Twitter
About FF
  • Mission
  • Products
  • User Guide
  • Media Kit
  • Blog
  • Contact
FF Products
  • Forums
  • Trades
  • Calendar
  • News
  • Market
  • Brokers
  • Trade Explorer
FF Website
  • Homepage
  • Search
  • Members
  • Report a Bug
Follow FF
  • Facebook
  • Twitter

FF Sister Sites:

  • Metals Mine
  • Energy EXCH
  • Crypto Craft

Forex Factory® is a brand of Fair Economy, Inc.

Terms of Service / ©2023